

Logfile Analysis Guide: Optimize Your Site’s Crawl Budget
Oct 12, 2026


If you base your analysis of search bot behaviour on JS-powered analytics, you may only have a partial understanding of crawler traffic patterns.
Conventional wisdom holds that script-based surveillance only observes interaction within browsers, meaning search engine robots performing silent background operations remain invisible.
To get an accurate picture of what bots can see on your website, you must scrutinise your server logs.
In this article, we will show you how to analyse log files to extract actionable data on crawl integrity and SEO.
| Key takeaways!The Ultimate Truth: A server access log captures every single request addressed to the server. This includes user agents that are not able to execute JS or are intentionally obstructed by tracker blockers. Crawl Budget: By studying URL parameters, you can find extra string data, broken screen scrapers, and other unnecessary crawl budget waste. Security: Suspicious user agents impersonating search spiders can be identified and blocked at the firewall level. Action: Export a month’s worth of server logs to a file, extract records that contain a search engine IP address, and compare them with your current XML sitemaps. |
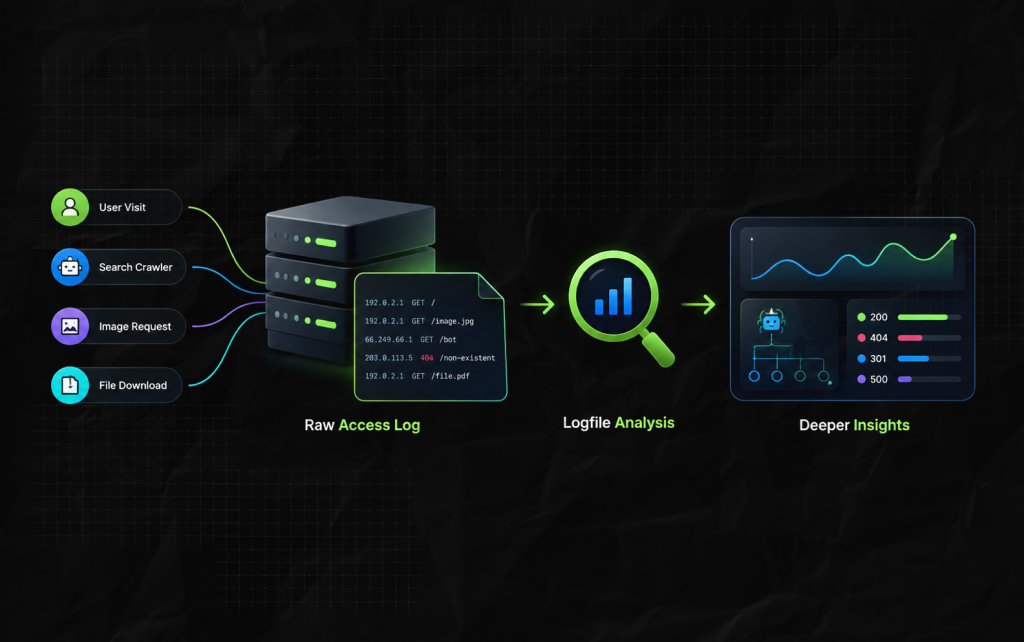
Every time a user or search engine crawler visits a web page, requests an image, or downloads a file from your site, your server records it.
This ongoing list of hits is called a raw access log. Analysing a single log file can turn thousands or millions of these cryptic text strings into an eye-catching graphic or a set of structural patterns.
Most website analytics tools rely on a small snippet of JavaScript that runs every time a page opens, but a server log captures activity at the lowest level.
If a search bot hits a non-existent URL and gets a 404 response, no page loads and no client-side code runs.
Moreover, you can see the big picture and better understand how crawlers traverse your site than you can from individual-page data through log file analysis.

You cannot just rely solely on traditional marketing analytics dashboards to fine-tune an enterprise-level website.
It’s like diagnosing an engine malfunction by listening only to the car’s dashboard.
Sure, you know something is wrong when the check engine light flashes red, but you won’t know which valve is faulty until you open the hood.
So, if a crawler gets stuck on a 503 Server Timeout error or gets rejected by an unexpectedly strict authentication barrier (401 Unauthorized), it is gone.
Since no HTML content was delivered, your marketing analytics dashboard will not report any activity.
Traditional log file analysis will immediately identify these issues.
For example, if one of your product categories is completely empty in your analytics tool,
Double-checking the server logs might reveal that search bots get swarmed with random 403 Forbidden errors because an overly aggressive firewall is blocking them.
Search engine bots are notoriously unreliable with client-side rendering.
While the main contenders are now quite adept at rendering modern JavaScript, they often split the process into two separate requests.
First, the crawler fetches the raw HTML, then (when the server allows) extracts the fully rendered content.
Lesser-known search engines often lose these subtleties in the noise because they lack the computational power to render your website’s JavaScript.
Server logs make no distinction between rendered and raw HTML.
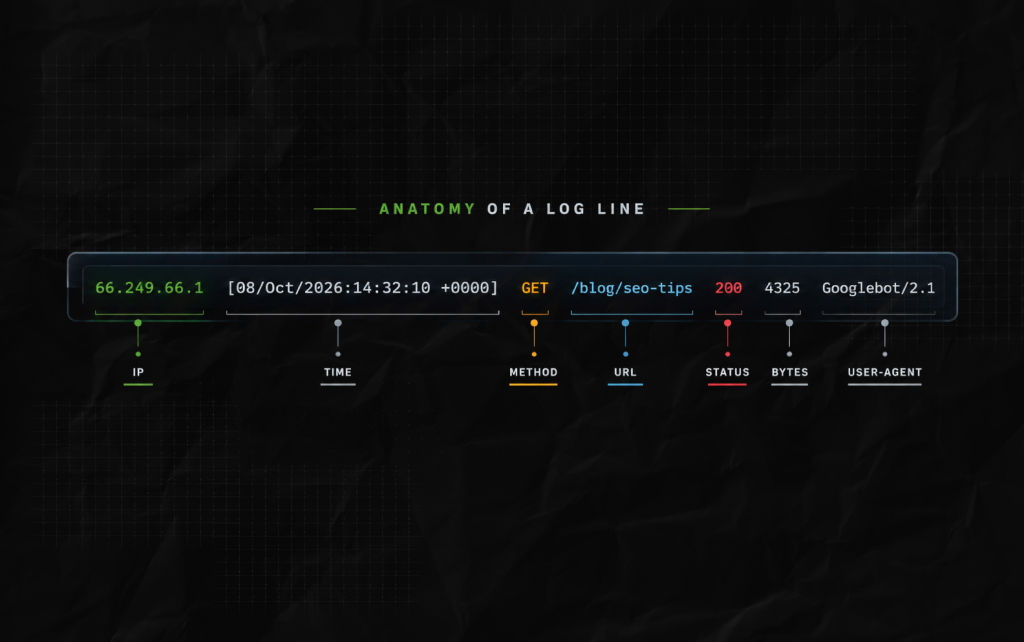
Before diving into how to analyze server logs with specific software, you should understand what the raw data looks like.
For any server, Apache, Nginx, or IIS, the information logged in Common Log Format or Extended Log Format remains the same.
Here is an example of an Nginx access log line:
66.249.66.1 – – [30/Sep/2026:16:09:05 -0400] “GET /pricing/?ref=nav HTTP/1.1” 200 12847 “https://example.com/” “Mozilla/5.0 (compatible; Googlebot/2.1; +http://www.google.com/bot.html)”
Let us dissect this line piece by piece to see what useful data we can extract from it:
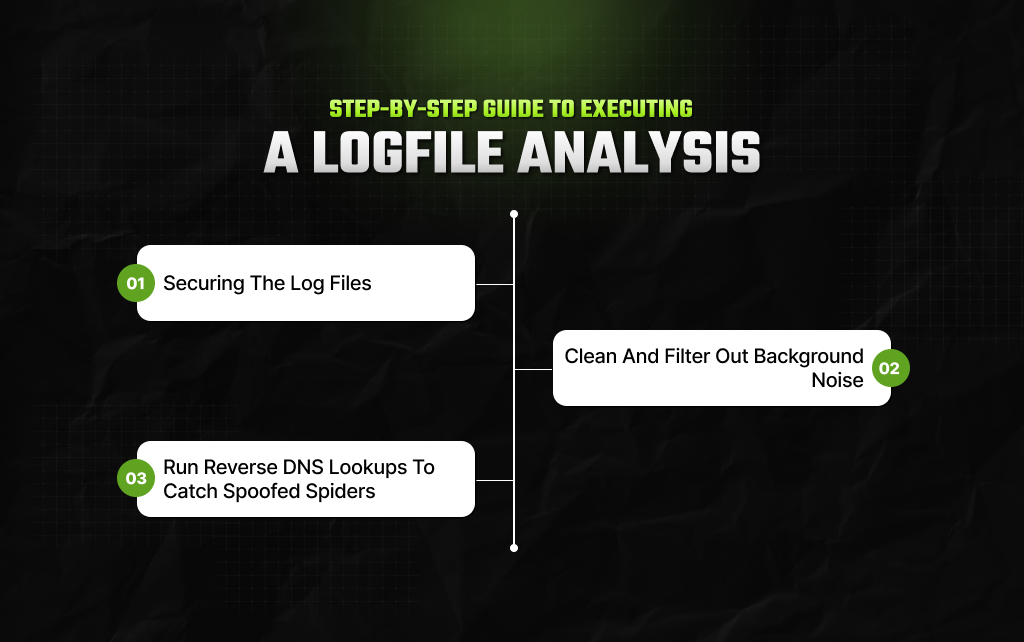
Processing a raw server log can be daunting if you run a large-scale website that gets several million hits per month.
Follow these guidelines closely, and you’ll manage to distill a mountain of text into actionable technical directives.
First, you will need to access your website’s server. You can use a standard shared hosting solution.
The chances are there’s going to be an intuitive dashboard (such as cPanel) that will list the
Raw logs include requests from regular human visitors, malicious scrapers, image assets, CSS stylesheets, and font formats.
You can use a cloud-based platform to host your enterprise-level solutions (consider AWS or DigitalOcean).
For this, you’ll have to use SFTP or SSH terminal sessions to navigate to the /var/log/nginx/ or /var/log/apache2/ system folders.
Either way, make sure you collect at least a month’s worth of data to account for daily server reboots, weekly updates, and similar events.
Next, process the data and remove noise that doesn’t represent real visitors.
Load up the log file in your preferred application and use filters to clean up the data.
You’ll want to remove any entry that doesn’t match the specific bots you’re interested in (Googlebot, Bingbot, etc.) or has an embedded image, CSS, or another asset.
Finally, perform a reverse DNS lookup on the IP addresses that appear most frequently in the dataset.
Hackers can spoof user agents to disguise their activities, but inspecting the first-level domain name will always reveal a bot.
Any reversed IP address that resolves to something other than googlebot.com (for Google Search bots) is spam and should be filtered out.
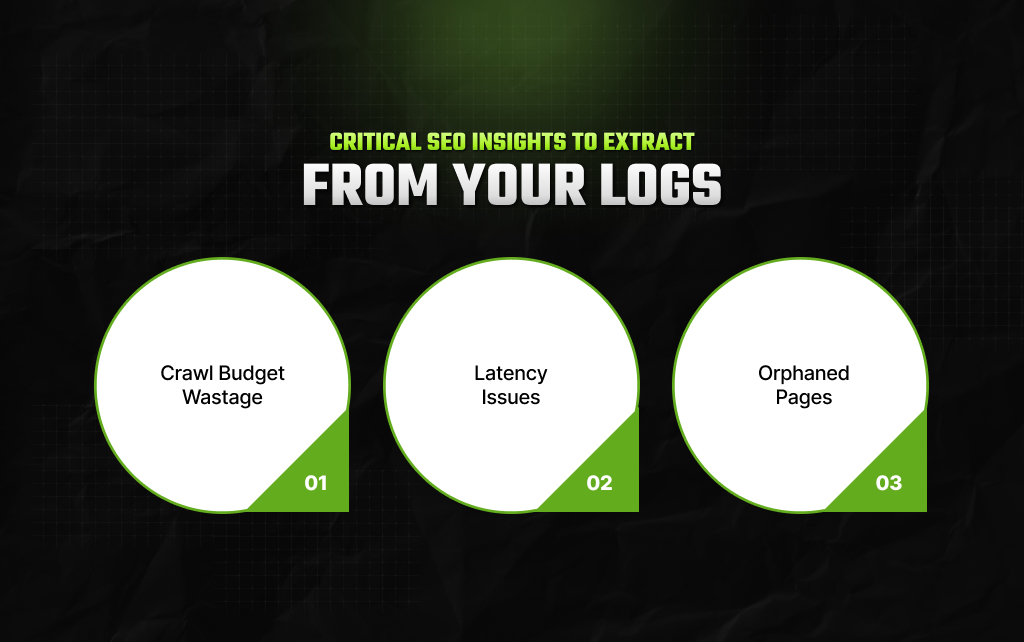
Once your data is clean and verified, look for these specific structural patterns to boost your organic search performance.
Track if search engine bots are wasting time crawling thousands of duplicate filter or parameter URLs.
Fix this in your server configuration or robots.txt. So bots focus only on high-value, commercial pages.
Monitor file sizes and long server response delays. High latency causes search engines to crawl fewer pages to avoid overloading the server.
Optimizing these slow directories instantly increases your overall crawl budget.
Identify pages that search bots can reach but have no internal links pointing to them.
Find these by comparing your log file URLs with a standard website crawl to uncover hidden, unlinked pages that still index.
When it comes to processing server data, you can choose from lightweight rank trackers to heavy enterprise analytics engines.
The right setup depends on your database size and technical comfort level.
| Tool Category | Best Used For | Key Advantages | Major Limitations |
| Dedicated Log Analyzers (e.g., Screaming Frog Log File Analyzer, JetOctopus) | Heavy technical diagnostics, large enterprise databases, instant file parsing. | Handles millions of rows without slowing down; built-in automated bot verification. | Does not track external ranking metrics or keyword trends natively. |
| All-in-One SEO Suites (e.g., SE Ranking, Serpstat, Semrush) | Integrated search tracking, multi-channel auditing, broad site monitoring. | Connects crawl data with rank profiles, backlinks, and competitors, as a comprehensive Serpstat Review might highlight. | File uploads are often restricted to smaller sizes or require manual log trimming first. |
| Command Line & Custom Scripts (e.g., Awk, Grep, Python DataFrames) | Raw filtering, server-side scrubbing, completely custom pipelines. | Extremely fast, free, highly customizable, no third-party data leaks. | Requires solid technical command-line knowledge and offers no ready-made visual dashboards. |
For smaller or mid-sized web properties, platforms like SE Ranking can monitor general indexation flags alongside standard audits and be enough for daily upkeep.
However, for large-scale websites or complex programmatic frameworks, a dedicated technical drill is indispensable.
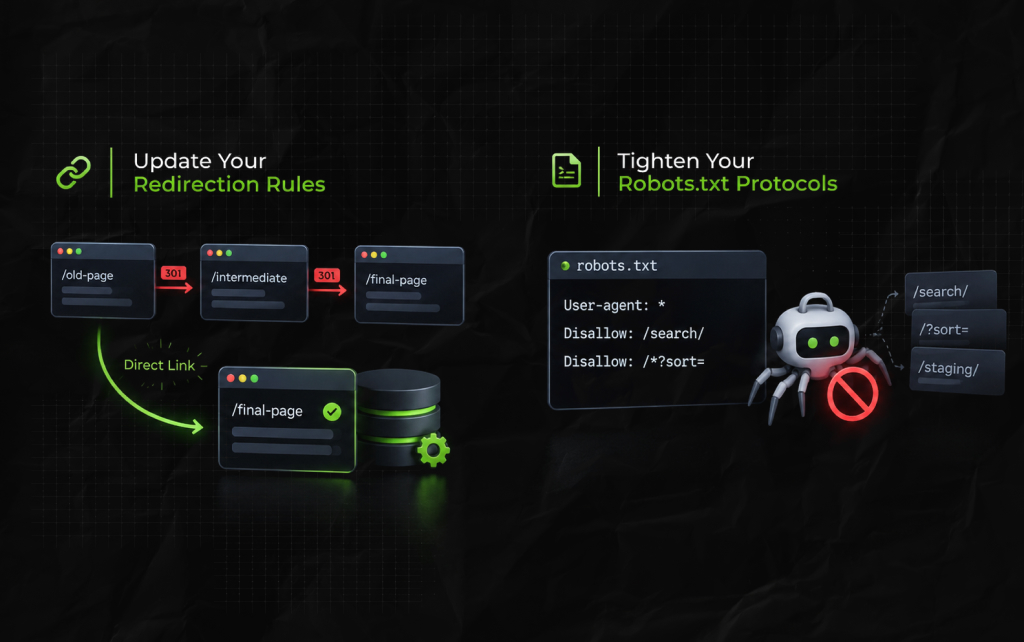
Finding the structural blockages in your server logs is only half the battle.
To turn these insights into higher organic rankings and smoother bot crawling, you must act directly on your site architecture.
Your logfile analysis reveals that search engines are spending considerable time bouncing through multi-step redirect paths (e.g., Page A -> Page B -> Page C).
So, you need to fix those links directly in your database or CMS.
Update every old internal link to point straight to the final destination URL.
This clears up the pathway and saves your crawl allocation for fresh, revenue-generating content.
You might see some non-canonical parameters, staging URLs, or internal search result pages cluttering your crawl logs.
In such cases, you can add explicit exclusion lines to your robots.txt file. For example:
User-agent: *
Disallow: /search/
Disallow: /*?*sort=.This simple instruction stops spiders from wasting resources on low-value pages and redirects their focus to your primary indexing paths.
Piyasa is a search engine marketing strategist who has spent the last six years decoding Google's ever-changing mind. From corporate giants to neighborhood storefronts, she helps businesses cut through the digital noise and actually get noticed online. When she isn’t building SEO strategies or writing the latest search industry breakdowns for Search Engine Magazine, you can usually find her hanging out with friends - and gently reminding them that no, she cannot personally fix the latest algorithm update for them.
View all Posts

The Ultimate Blueprint To Majestic SEO: How T...
Oct 12, 2026
SE Ranking Review 2026: Is It The Ultimate Bu...
Oct 12, 2026
PRNEWS Rewards Adds Rankfor.AI To Track How B...
Oct 10, 2026
Is Serpstat Worth It? A Deep Dive Into Pricin...
Oct 09, 2026
How To Use Screaming Frog: The Definitive Tec...
Oct 09, 2026