Watch TikTok Without The App: Every Method That Still Works In 2026
Jun 26, 2026

Business Intelligence (BI) data has become one of the requested forms of data that businesses need. It helps the management to make the right decisions regarding their strategies and operations. In this regard, Google’s Looker Studio Pro is the best BI app that businesses should use in 2023 and beyond.
But are you using this app as a business owner? Or do you not know how to use it and what benefits you can reap by doing so? If that’s the case, then you are in the right place.
Read this post till the end to learn how to use Looker Studio Pro and what benefits you gain by doing so!
The various benefits and features of Google’s Looker Studio Pro that make it a compelling choice for gathering and operating with business intelligence data are:
Looker Studio Pro enables users to delve deep into their data, exploring complex datasets to uncover valuable insights. The platform offers a user-friendly interface that allows for intuitive exploration, allowing users to slice and dice data, apply filters, and drill down into specific details.
This makes it the perfect tool for SEO consultants and SEO freelancers using an SEO API in tandem!
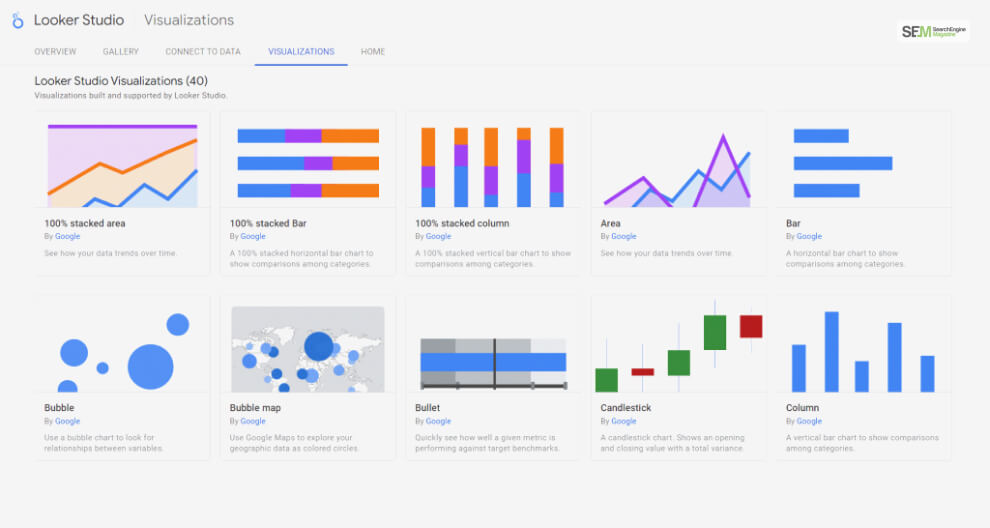
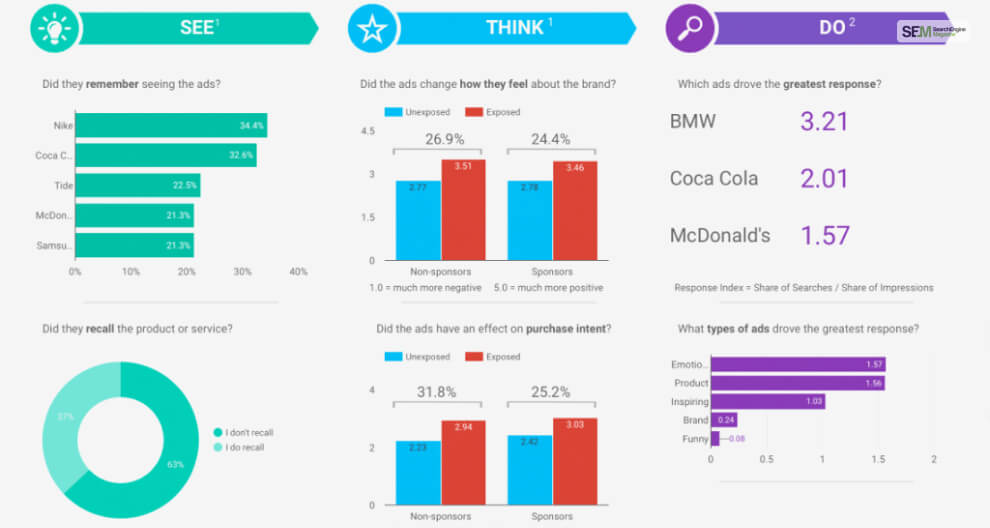
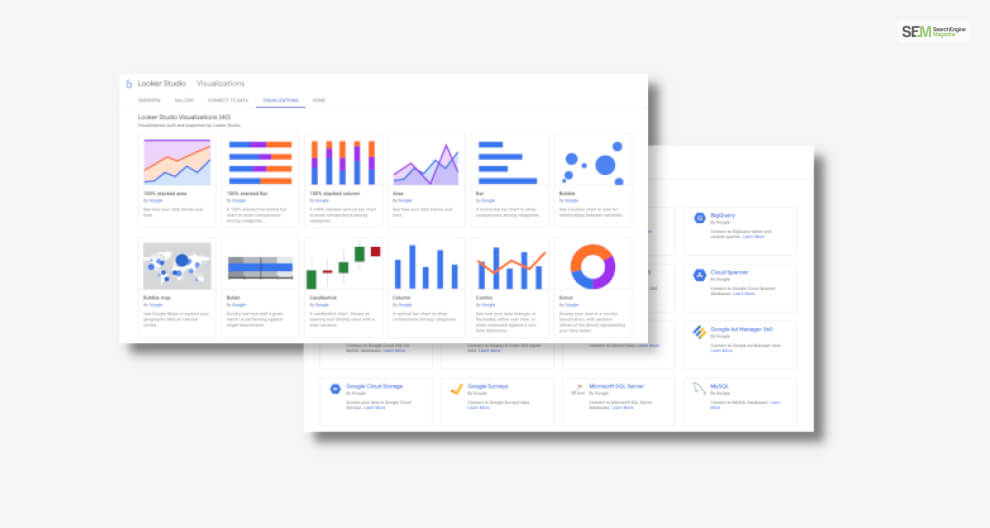
Visualizations are a powerful tool for understanding complex data. Looker Studio Pro offers a wide array of visualization options, from charts and graphs to heat maps and maps. These interactive visualizations make it easier to communicate insights, trends, and patterns within the data, enhancing data-driven decision-making.
Looker Studio Pro provides the ability to customize and brand your data visualizations and dashboards to align with your organization’s branding guidelines. This not only enhances the visual appeal but also creates a consistent and professional representation of your analytical intelligence.
Collaboration is crucial in any data-driven organization. Looker Studio Pro offers collaborative features that allow teams to share insights, collaborate on dashboards, and provide comments within the platform. This fosters better communication and alignment across departments and teams.
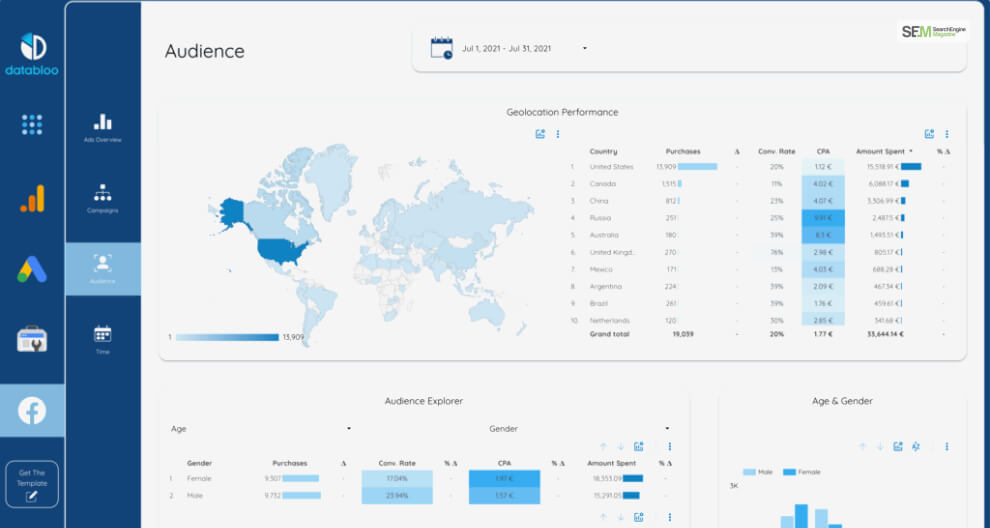
Looker Studio Pro ensures that you’re working with the most up-to-date information. It integrates with various data sources, enabling real-time data connectivity. This means you can make decisions based on the latest data, staying ahead in a rapidly changing business environment.
This is highly beneficial for ecommerce website development since you get real-time data on various website metrics. Plus, having a GA4 certification will make this even easier!
Data security is a top priority for any organization. Looker Studio Pro offers robust security features, including user authentication, role-based access controls, and encryption. This ensures that sensitive data remains protected and accessible only to authorized users.
As your organization grows and your data analytics needs expand, Looker Studio Pro scales with you. The platform can handle large volumes of data and users without compromising performance, ensuring that you can continue to extract insights from your data as your business evolves.
Looker Studio Pro integrates seamlessly with various data sources, databases, and business applications. This means you can pull in data from different systems and create comprehensive, unified insights that provide a holistic view of your business operations.
Ultimately, Looker Studio Pro empowers organizations to make data-driven decisions. By providing a comprehensive, intuitive, and interactive platform for exploring data, the platform equips users with the insights they need to make informed choices that drive business growth and success.
While Looker Studio Pro offers advanced features, it is designed to be cost-efficient. Its capabilities help optimize data analytics processes, leading to better resource utilization and cost savings in the long run. This is why many white label SEO firms use this tool.
Here’s a detailed step-by-step guide on how to use Looker Studio Pro:
First, you need to access Looker Studio Pro. Here’s how you do so:
After you access Looker Studio Pro, you must learn its layout for easier accessibility. Here’s how you do so:
After you get used to the interface, especially its intuitive dashboard, here’s what you need to do next:
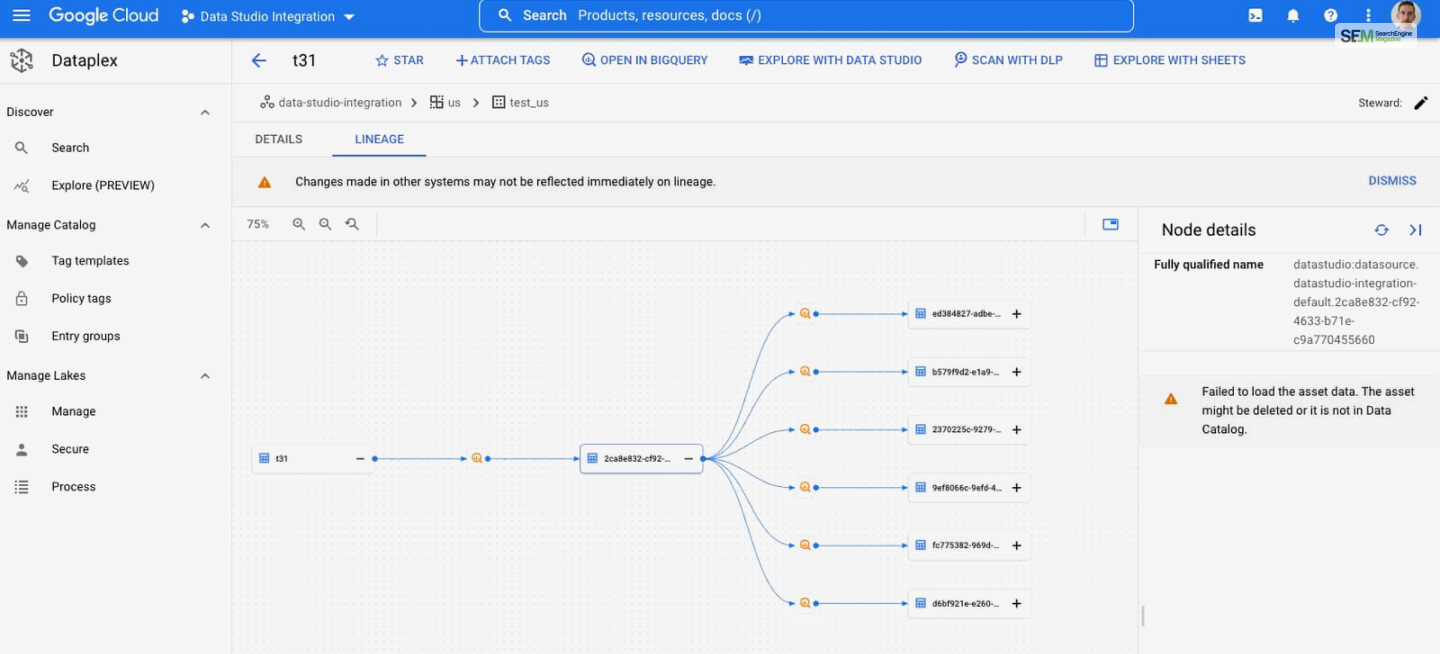
After you connect to data, follow these steps to create data models in Looker Studio Pro:
Now that you have created your data model, it’s time to build a query in Looker Studio Pro! Follow these steps to do so:
The query you create will generate the Looker BI data that you need. Now, you only need to explore them by following these steps:
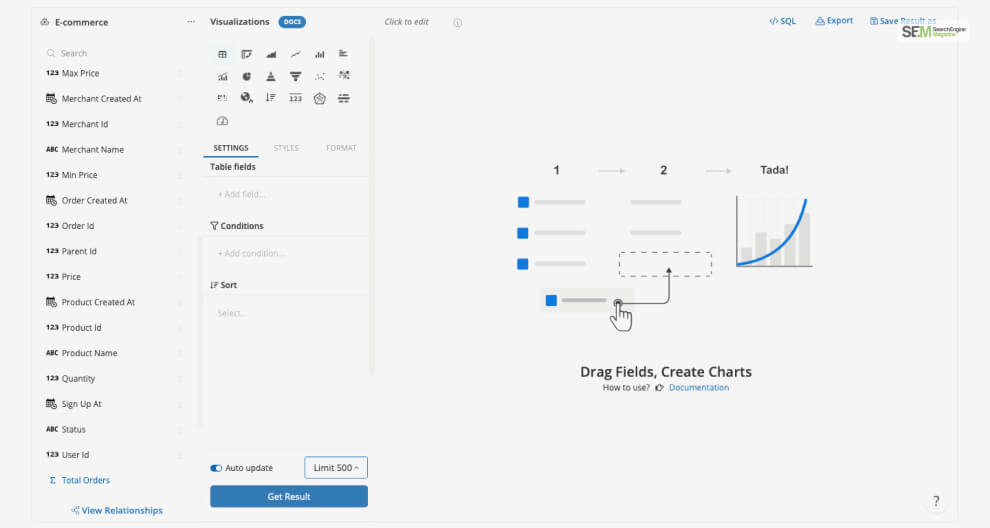
To visualize all the data available to you, follow these steps:
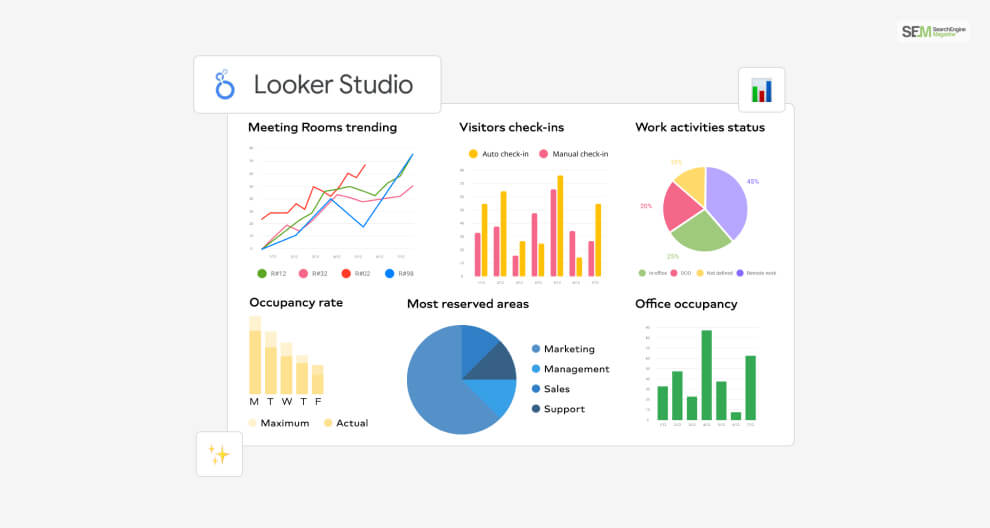
After you visualize your data, it’s time to create your dashboard. Here’s what you need to do:
The main reason we created a Looker Studio Pro dashboard was to make the BI data shareable with others. Therefore, after creating the dashboard, follow these steps to share it with your collaborators:
Finally, it is time to refresh the data periodically and automate its updates and notifications. Here are the steps you must follow to do so:
Congratulations! You’ve successfully learned how to use Looker Studio Pro! Remember, practice and exploration will help you become more proficient in harnessing the power of data insights using this versatile platform. Keep this in mind and see how it affects your business decision-making skills!
If you have any queries regarding the use of this app, let me know in the comments below!
More Resources:
Mashum Mollah is the feature writer of SEM and an SEO Analyst at iDream Agency. Over the last 3 years, He has successfully developed and implemented online marketing, SEO, and conversion campaigns for 50+ businesses of all sizes. He is the co-founder of SMM.
View all Posts

Watch TikTok Without The App: Every Method Th...
Jun 26, 2026
How Industry Networks Help Accelerate Career ...
Jun 26, 2026
Mental Health Screening Before Plastic Surger...
Jun 26, 2026
What Is The QY-45Y3-Q8W32 Model? Separating F...
Jun 25, 2026
Your HR Team Can Design A Stunning Event Post...
Jun 25, 2026