Why Nationwide SEO Services Matter For Brands Ready To Grow Beyond Local Search
Jul 10, 2026

Question: what report shows a visual representation of user interactions on a website?
Answer: Behavior Flow report.
Here are four different alternatives you need to choose from the question asked. The right answer is – The Behavior Flow report. But why is the behavior flow report the visual representation of the website?
We have explained that in this article.
Here is the explanation you need regarding the answer –

The behavior flow report can visualize users’ paths that they take while traveling from one page to the other. This gives you a way of finding out the content that keeps the users engaged and the content that does not. Based on this insight, website owners can change their content strategy for new content or modify content already published on the platform.
On the other hand, the other reports, like the Content Drilldown report, Landing Pages report, and Treemaps report, do not show a visual display of the user interaction on any website.
But what is the behavior flow report?
Read More: What Metric-Dimension Combination Is Not Valid?
As said before, the Behavior flow report is the path the users have taken to travel from one event to another or from one page to another. Such user behaviors on the website keep the users engaged with your website. The behavior flow report is capable of assisting to find out the potential content issues.
There are many benefits to assessing user flow reports. It gives you ways to compare traffic volumes from different sources and examine your traffic patterns through your site. It also allows you to troubleshoot the efficacies of your website.
It is very important to have a setup and keep tracking your events before they happen or appear in your behavior flow report. The ease of using behavior flow reports from the event views or event pages depends upon the level of your setup or arrangement of the event tracking code.
You should also have content groupings prior they show up in your behavior flow reports. These are the two requirements of a behavior flow report for you to succeed in using the behavior flow report.
So, how do you access the user behavior flow report? Here are the steps required for that –
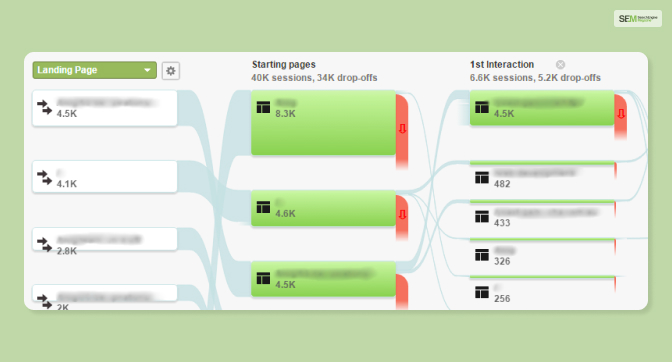
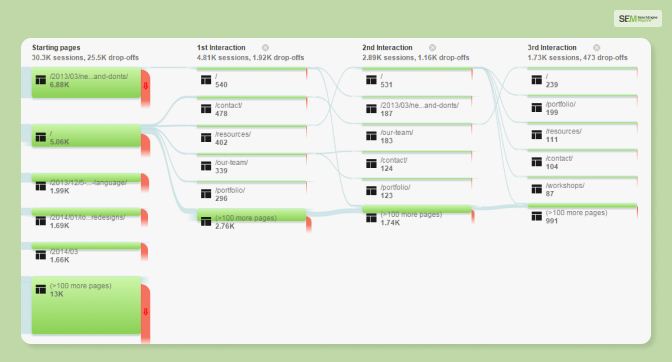
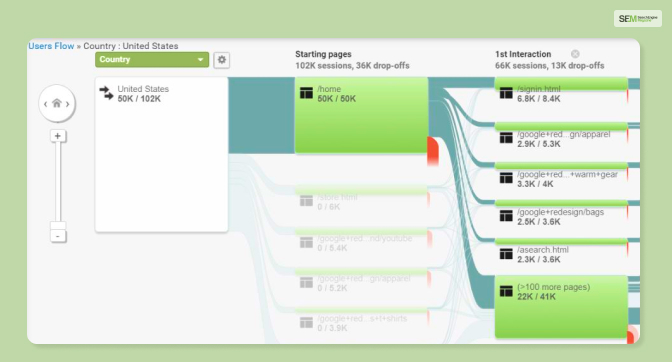
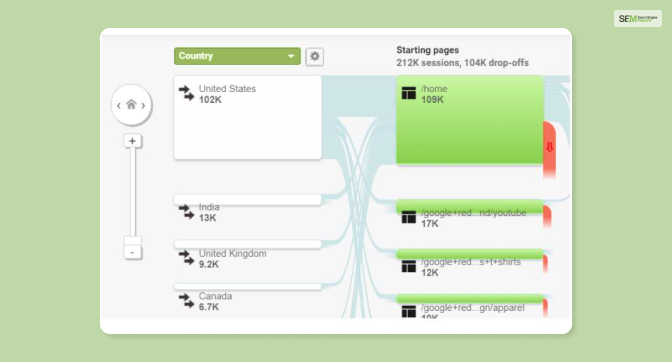
So, what does the user behavior report look like? Like all flow reports, there are nodes, connections, and exits in the behavior flow reports. This report shows your traffic flow.
The nodes are the points that are the points for your traffic flows through. The behavior flow report represents the nodes in different forms based on the view you choose.
The page nodes appear in green, the event nodes appear in blue, and the dimension nodes are white. You can click on a specific node to explore or highlight the traffic through that node. You can also see individual pages and events that are grouped in that particular node.
A Connection in the behavior flow report indicates the path from one node to another. It also shows the traffic volume passed on through that path. You can click on a specific connection to see the traffic segment that flowed through that path.
The exit indicates the point where the users left the flow. No, the exit does not necessarily indicate where the customers left your website. In the Events view, it only shows that a traffic segment did not cause another event.
Read More: When Will Google Analytics Be Unable To Identify Sessions From The Same User By Default?
For your business, making sure people stay connected is like keeping the engine running smoothly. Here are some simple yet powerful advantages:
Builds Connection: When you talk to users, it’s like having a nice conversation. It creates a link, making them feel important and listened to.
Feedback Goldmine: People tell what they think and feel. This feedback is very valuable for your business. It tells you what is good, what needs fixing and their customers’ favorites.
Boosts Trust: A responsive business breeds trust. When people know you’re ready to help or listen, it makes them feel like they can count on you and believe in your honesty.
Humanizes Your Brand: Interaction humanizes your brand. It’s not just a nameless thing; it is a company that cares for its customers. Responding quickly and truly is very helpful.
Addresses Concerns Swiftly: People might have questions or worries. Being aware of interaction lets you deal with these quickly, fixing problems before they become big issues.
Encourages Loyalty: When people feel listened to, they are more likely to stay. It fosters loyalty. They know they are dealing with a company that cares about its customers.
Spotlights Customer Service: Great customer service stands out. Talking to customers shows how much you care about doing a good job for them. It’s like shining a light on your amazing service.
Here are some additional questions and answers that you might find helpful.
Ans: The report that indicates the pages of a website where users first arrived is known as the “landing pages report”. This report provides information about the initial page that users landed on when they visited a website. It is a valuable tool for analyzing user behavior and understanding which pages are most effective in attracting and engaging visitors.
Ans: To get accurate data in a custom report, it is important to avoid taking actions that can skew or manipulate the data. Some actions that should be avoided to get accurate data in a custom report include. One should specifically avoid pair metrics and dimensions of different scopes to obtain accurate data in a custom report.
Ans: Google Analytics has strict policies in place regarding the collection of a particular types of data to protect user privacy. Some of the data that Google Analytics prohibits collecting include – Personal information, Sensitive Information (financial information, health or political information) User IDs, IP addresses, etc.
“What report shows a visual representation of user interactions on a website?” I know that you have found the answer already, and it is the behavioral flow report that has a visual representation of the user interaction. The rest of the alternative options are not correct answers to these questions.
I hope that you have found the answer to your question. However, if you have any other queries please reach out to us in the comment section. We will reach out to you as soon as possible.
Shahnawaz is a passionate and professional Content writer. He loves to read, write, draw and share his knowledge in different niches like Technology, Cryptocurrency, Travel, Social Media, Social Media Marketing, and Healthcare.
View all Posts

Why Nationwide SEO Services Matter For Brands...
Jul 10, 2026
Domain Authority Explained: What It Measures,...
Jul 09, 2026
Technology Providers For Hyper-Personalized C...
Jul 08, 2026
Do Google Reviews Help SEO? What They Actuall...
Jul 08, 2026
Negative SEO: How To Spot, Stop, And Recover ...
Jul 07, 2026