How To Optimize Images For SEO? Easy Steps To Improve Site Speed And Ranking
Jul 15, 2025
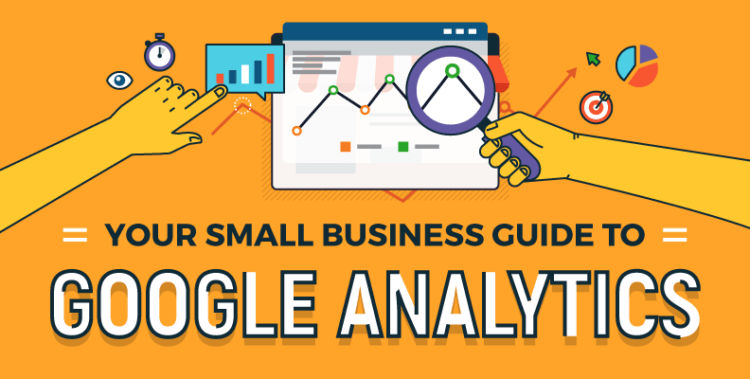

Google Analytics is probably the most powerful tool a small business owner can use when looking for insights about their online presence. Plus, how to make the most of it. Modern businesses generally spend a relatively large portion of their marketing budget on digital endeavors. Thus, having an excellent free tool to be able to drill down into every visitor interaction. Therefore, it is a great boom with your site when you know how it is performing.
Such a great tool and knowledge is all well and good, however, the problem for the uninitiated can often be, “How exactly do I get it to work?”. To answer that very question, and a huge amount more, Headway Capital have put together this infographic with some helpful hints on how to start harnessing the power of Google Analytics to improve your business’ performance.
Setting up your Google Analytics account is relatively easy. You can log in with any Google account (which includes Gmail and YouTube). Give them the name of the site you want to start tracking and you will get a unique tracking code. Simply enter this code inside your site’s CMS or use a WordPress (or other CMS) plugin to do it for you. Now your site’s information will pass securely to your Analytics account.
One of the first things you’ll notice about Google Analytics is the wealth of information it provides. It is about what people are looking for in your website. It shows how many users visit your site daily, weekly and monthly. Plus, the average visitor spends on your site.
It also gives you a breakdown of what devices users are accessing your site from, which is vital for making sure your site and content is tweaked for optimum performance for desktop, mobile or tablet users. Importantly for e-commerce sites, you can also set up goals to find out where visitors leave the ordering process.
Along with the geographical locations where your visitors are based, Google Analytics also tells you where on the web they arrive at your pages from. There is a detail data on the keywords that users type into search engines to find your business. As advertising and social media campaigns are mainly based on links to your landing pages there is also the possibility of monitoring their progress and success from specific channels.
There are also several metrics within Google Analytics by which you can find out where your site could improve. As well as the aforementioned sales funnels, you can view a full rank of all your pages by views. This is how you discover which ones need to have their content or layout tweaked.
Another important metric is bounce-rate. This is the percentage of users which leave a page without visiting another on your site and is great for identifying which parts of your site are causing visitors to leave and not continue to your conversion process.
If you haven’t already started using Google Analytics, or at least haven’t been using it to its fullest effect then now is the time to start. As well as giving you a better understanding of what people like about your site it also shows you how you can be doing things better. This helpful guide should provide plenty of insights about how to get the power of Google Analytics working in your favour.
Read next:
Mashum Mollah is the feature writer of SEM and an SEO Analyst at iDream Agency. Over the last 3 years, He has successfully developed and implemented online marketing, SEO, and conversion campaigns for 50+ businesses of all sizes. He is the co-founder of SMM.
View all Posts
How To Optimize Images For SEO? Easy Steps To...
Jul 15, 2025
Quickwin: Your Gateway To Premium Online Ente...
Jul 12, 2025
Top 7 HVAC Marketing Mistakes That Are Tankin...
Jul 12, 2025
8 Top AI Market Research Tools For Fast And A...
Jul 12, 2025
How A Smart Seo Agency Uses Guest Posting To ...
Jul 10, 2025