
Is Serpstat Worth It? A Deep Dive Into Pricing, Data Accuracy, And Features
Oct 09, 2026
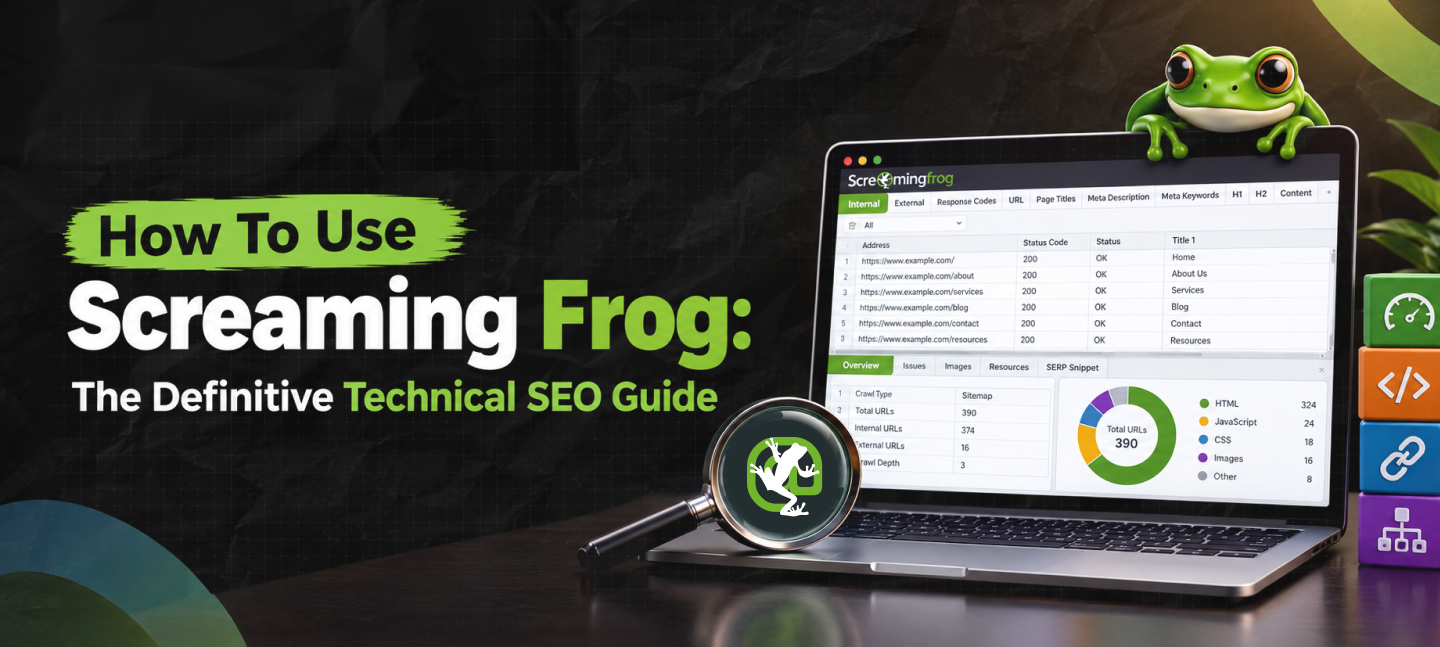

The first time you open Screaming Frog SEO Spider, you may face a dizzying array of tracking panels, hundreds of active data columns, and flashing performance metrics.
It’s easy to get caught up in the noise or accidentally hit the wrong button and take a client’s staging server down mid-audit.
To learn how to use Screaming Frog, you will need to learn more than just the menus.
Whether you want to fix broken internal links, find complex redirect chains, render pages with JavaScript, or extract custom data from thousands of pages, here are the production-ready ways to get the job done.
| Key Takeaways • License Frameworks: The free tier caps processing at 500 URLs per job and locks out crucial workflows like custom scripts, scheduling, and external API integrations. • Storage Architecture: Always switch the app to Database Storage mode when working on solid-state drives (SSDs). This auto-saves data to your disk and prevents the application from freezing during large crawls. • Server Safety Rules: Reduce the initial crawl speed to 2–3 threads on smaller hosting setups or staging environments to avoid triggering server firewalls or slowing down live performance. |

Master large-scale site audits by optimizing storage, regulating crawl speeds, and unlocking advanced data extraction workflows without crashing your system.
Before opening any website in the address bar, you must configure how the application uses the computer’s memory to process data.
By default, the program works in the RAM, which is fast computer memory.
However, if you audit large corporate sites or online stores with thousands of pages, the application freezes and loses crawled data.
This is because the computer’s RAM isn’t enough to process thousands of pages.
To fix this, change the storage mode. Open the File menu, then select the Storage Mode option (or switch the application menu settings for macOS).
Switch the engine to Database Storage.
| Storage Mode | Ideal Use Case | Data Safety Benefit |
| Memory Storage | Small sites (<10,000 pages) on classic hard drives | Rapid processing times, but relies entirely on available system RAM. |
| Database Storage | Large enterprise sites (>50,000 URLs) on modern SSDs | Auto-commits records directly to disk. Recovers cleanly from unexpected power losses. |
Once database storage is active, navigate to File > Settings > Memory Allocation.
For standard enterprise sites up to two million pages, allocate 4 GB to 8 GB of RAM to ensure smooth data rendering without slowing other computer operations.
The program has two modes of operation: Spider and List. Spider follows links from the provided address, while List lets you spider websites copied into the clipboard.
Before launching the spider on the client’s website, set the speed limiter.
By default, the tool uses 5 threads to maintain a consistent data flow across medium-sized servers.
Yet, any firewall protection may be triggered by the same number of threads.
Check the “Limit Max URL/s” box and set the thread count to 1 or 2 to avoid suspicion. The tool is useful for old servers or databases with staging areas.
Dead assets and broken links inside the page severely harm the user experience and damage the search crawl budget. Finding those dead paths is one of this tool’s first use cases.
To get all broken paths, let your crawl finish (or just reach 100% if you paused it) and go to the top Response Codes tab.
Open the sub-filter dropdown right below it and select Client Error (4xx).
It will show all the dead target assets, but you need to get those links and see exactly where they’re placed. Here is how you can achieve that:
To share those issues with your web development team, open the top menu bar > Bulk Export > Response Codes > Client Error (4xx) In Links.
It will export a spreadsheet with all broken links and their sources on your site.
While single redirects (301 Moved Permanently) are common during website updates, redirect chains involve multiple steps.
They also cause excessive server delays, which worsen site performance.
In these cases, you can use an alternative with fewer redirects. To do that, first, open the Response Codes tab and choose the Redirection (3xx) option.
Then, you will be able to see the list of files involved in the redirect chains.
However, scanning most of the data takes a lot of time, especially for a large website.
To do this automatically, a report does it for you. To get there, go to Reports > Redirects > Redirect Chains.
After you export a file and understand how to use Screaming Frog, it will include the redirect history and enough detail to see which URL leads to which page.
Then you can remove those redirects from the code manually and replace them with a single, final destination.
Missing or misformatted page tags can damage your click-through rates in organic search results.
The tool separates these snippet parts into their own workspaces so you can review them at scale.
Open up the Page Titles tab / the Meta Description tab to see your content.
You can use the filters for over 60 Characters on the former, and over 155 Characters on the latter.
This can help you see which of your tags would get cut off due to length in the search snippet.
But make sure to also look over the Duplicate filter.
Having the same title text appear for products in different categories, or across blog posts, can confuse crawlers and hurt your ability to rank normally.
Technical issues are more apparent when viewed in the context of actual performance.
By connecting external APIs, you can see which broken or unoptimized pages are actually impacting traffic.
Before initiating a new crawl, navigate to the top menu bar and select the Configuration > API Access > Google Search Console option.
You’ll then be prompted to authorize your account and select a verified site property in order to establish the connection.
During the crawl process, the interface pulls in search clicks, impressions, and click-through rates, which you can use to filter your technical issues.
This helps you prioritize queries by impact, ensuring you’re not spending time on low-level archival issues that have no traffic.
Instead, address high-impression queries with optimization or fixes.
Modern single-page applications, typically built with ReactJS, AngularJS, or VueJS, challenge basic text-based crawlers.
If your website requires client-side JavaScript execution to display text content and navigation menus, a standard spider will not see those pages’ contents at all
To resolve this issue, visit Configuration > Spider > Rendering, and change the default Text Only option to JavaScript.
This will allow the crawler to properly render your pages by utilizing an internal Chromium engine.
Note that for websites that make heavy AJAX requests to external databases, you might need to increase the AJAX timeout window up to 15-20 seconds in your rendering settings.
This will give your server enough time to return a response before the crawler proceeds to the next URL.
Beyond technical health checks, the tool can also extract specific on-page data points like inventory counts, product prices, or SKU numbers directly during a crawl.
To build a custom extraction rule, open Configuration > Custom > Extraction. Click Add to create a new rule, and change the selector type to XPath.
When you start your crawl, the software extracts matching data from every page it visits and organizes it into a clean Custom Extraction tab. This lets you audit inventory statuses, find thin content, or track missing product attributes across your entire site without manual scraping.
Additional Resource: Top 65 Search Engines In The World
Piyasa is a search engine marketing strategist who has spent the last six years decoding Google's ever-changing mind. From corporate giants to neighborhood storefronts, she helps businesses cut through the digital noise and actually get noticed online. When she isn’t building SEO strategies or writing the latest search industry breakdowns for Search Engine Magazine, you can usually find her hanging out with friends - and gently reminding them that no, she cannot personally fix the latest algorithm update for them.
View all Posts

Is Serpstat Worth It? A Deep Dive Into Pricin...
Oct 09, 2026
Master The Rich Result Test: Fix Your Broken ...
Oct 08, 2026
Does vnROM Bypass Still Work? A Realistic 202...
Oct 08, 2026
Event Pages That Rank And Convert: A Practica...
Oct 06, 2026
KeywordStat Review: Keyword Research, Cluster...
Oct 03, 2026