Enterprise Search Guide: Modern Knowledge Management & Internal Data Discovery
Nov 03, 2026

Many enterprise leaders will face a major conundrum after implementing automation or generative software.
They may see high employee adoption but no change in core processes, leaving them struggling to show tangible financial benefit.
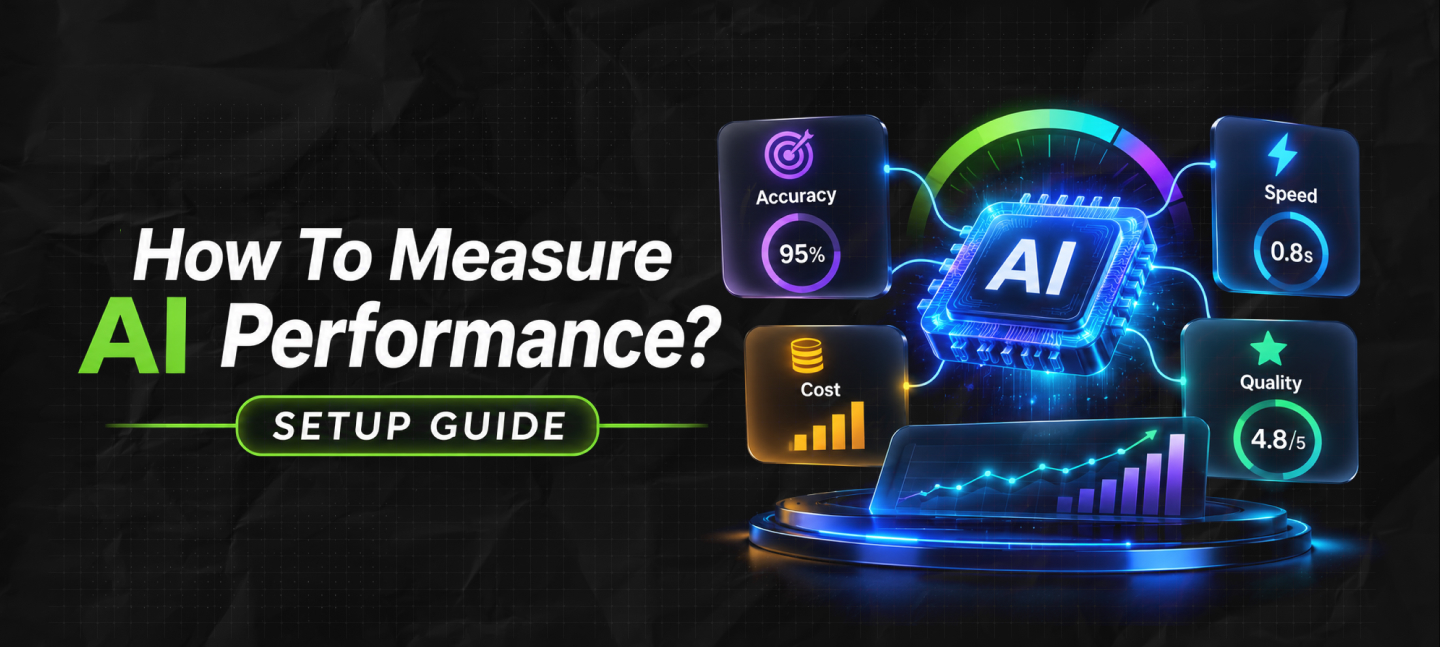
If you’re wondering how to measure AI performance, the answer lies in a multi-layered approach.
This will help you link together machine performance with business outcomes.
In this guide, I will give you the formulas, benchmarks, and implementation steps you need to turn ambiguous AI experiments into tangible decision-making.
To properly understand how to measure AI performance, you must evaluate your systems across three distinct dimensions:
Critical Insight: Avoid evaluating probabilistic AI models with static, deterministic IT metrics. Traditional metrics fail to capture the inherent uncertainty and dynamic reasoning of modern language models and autonomous agents.

Introducing automation or generative software to your organization can be a huge financial investment.
When measuring AI performance, your board will expect insight into how you are measuring it.
Many leaders fall into the trap of measuring AI performance using traditional IT benchmarks.
Moreover, traditional software is deterministic, meaning that it will always take input X and produce output Y.
However, AI models are probabilistic and therefore use complex reasoning and data retrieval techniques to provide answers.
Over 80% of enterprise leaders identify reliability as their number one priority, but only 35% of leaders have a system in place to track it. (IBM extensive research).
By measuring only output volumes, you will miss many key insights.
Measuring how much code or customer lines your machine is producing does not tell you anything about the quality or security of the output.
Understanding how to measure AI performance starts with looking at your machine learning model.
These metrics help your engineers understand whether your base models are processing data correctly.
Model Accuracy: This measures how often your model produces 100% correct outputs.
So, a 5% increase in accuracy can reduce repeated customer questions and keep satisfaction levels consistent.
Precision Index: This measures how often your model produces correct positive predictions. High precision decreases the false positives.
Recall Depth: This measures how well the system can detect all target items/intents in a dataset. So, high recall means your platform will not miss key business problems.
F1 Score: The F1 score specifically combines precision and recall into one metric. It gives you assurance that your software isn’t over-flagging issues.
Once you have proven your model can think accurately, you need to measure how well it is performing in an enterprise environment.
Moreover, once you start to measure the efficiency, it will help you understand two specific things:
Response Latency: This shows how long your machine takes to respond once it receives input.
Aim for latency between 0.1 and 1.0 seconds to keep your tools efficient.
Volume: This Measures how many unique queries/tasks your software can complete. High volume ensures your system can handle peak traffic.
Usage: This will show how many API tokens, blocks of memory, or cores are being used per task. Keeping this number low will help keep your costs down.
Error Rate: This shows what % of outputs are broken, empty, or failed.
So you need to keep it low. As a result, it will help build trust in your system, especially in key industries such as healthcare or financial management.
| Operational Metric | Business Focus | Target Enterprise Benchmark |
| Response Latency | User Experience Quality | 0.1 to 1.0 Seconds Max |
| Workload Throughput | Platform Infrastructure Scaling | High Task Vol. / Minute |
| Compute Usage | Operational Cost Management | Low API Token Overhead |
| System Uptime | Service Level Agreement Health | 99.99% Availability Baseline |
If you are wondering how to measure AI performance, you will need language- and task-specific metrics.
These will help ensure your generative models sound natural and realistic.
BLEU / ROUGE Score: This measures how much your AI-generated text matches real-world examples.
So, a high score helps ensure your customer-facing tools sound natural.
Hallucination Rate: This measures how often your model confidently provides verifiable false data.
Keeping this to a minimum is important. You cannot really provide incorrect information about products/policies to customers. As a result, it will reduce trust in your brand.
Autonomous agents perform multi-step tasks such as checking an order, return policy, and providing a refund.
You should look at the rate for goal completion to measure how well your agents are performing.
This will show what % of tasks were completed from start to finish.
Also, pair this with the Multi-Step Reasoning Score to ensure your machine takes a logical route and doesn’t get stuck in loops.
Measure AI performance at a leadership level by looking at financial impact. Link machine performance to business outcomes.
This measures how much value your AI project provides compared to the cost of building it. Moreover, 75% of companies using generative tools see a return.
Top enterprises are seeing an average 13% ROI. While slower adopters see an average 5.9% ROI.
This shows how much you reduce costs across your business through automation.
You just need to optimize the internal customer service processes. This way, you can reduce costs by up to 30%.
However, you need to ensure your measurement systems aren’t creating false velocity.
If your machine generates 50% more output but has errors, it is a loss.
Sentiment Change: This lets you see how customers feel before and after using your tool.
If you can show how you are turning frustrated customers into happy ones, it proves your system can adapt to real-world situations.
Adoption Rate: This shows how often your internal team uses your tools. Even the best software will fail to provide value if employees don’t use it.
Many operations managers will believe having a strong governance system will slow your technology down.
However, global research shows that a strong, structured data logging system can actually boost your business.
Companies that can provide instant AI auditing evidence see 3 to 6x more operational improvements than businesses that aren’t monitored.
Strong auditing practices increase confidence in scaling from 14% to an impressive 42% [2].
To measure this, you should look at the following two metrics.
Explainability Index: This will measure how well your data science team can explain the logic behind your autonomous models.
Data Lineage Volatility: This will show you how often your main data source has changed.
A high score means you have concept drift, which will cause an average 3.6% drag on your revenue.

Saying your system saves 4 hours per week is not enough for modern executive boards.
As your agentic models become more sophisticated and take on complex tasks, your measurement system needs to track P&L variables.
Data from the latest Deloitte State of AI in the Enterprise Report shows that 37% of organizations use technology only at a surface level [3].
Top performers, however, are focused on making real changes to their core processes.
To match this, look at how many Human Equivalent Labor Hours you deliver per dollar.
If your autonomous software agent completes multi-step procurement/customer support containment tasks at a lower cost, you can see the value on your bottom line.
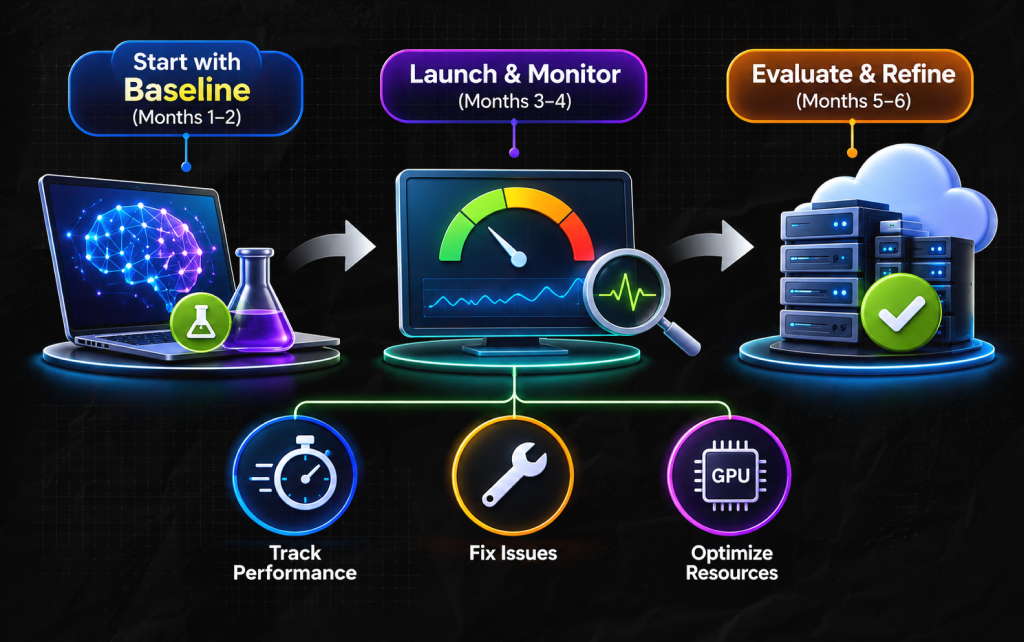
A major bottleneck for many companies is deploying their sophisticated models. This is known as the Production Gap.
Data from the Stanford HAI AI Index shows that while overall adoption is reaching capacity, companies are differentiating themselves by how quickly they can scale their experiments [1].
Top tech frameworks from the Google Cloud Technical Team look at the following 3 MLOps metrics.
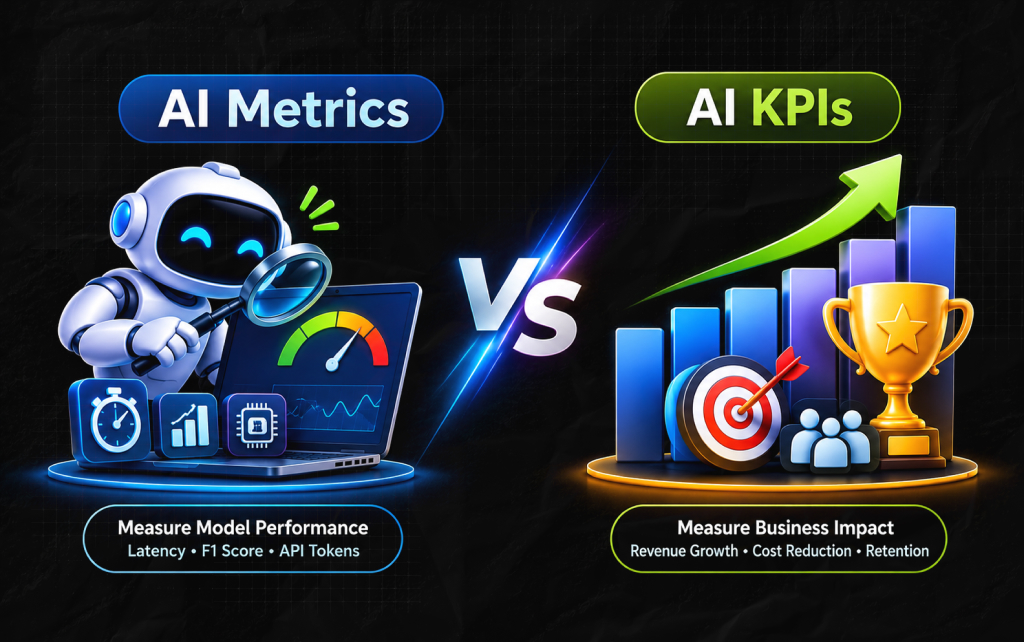
Many team leads will get confused between AI metrics and KPIs so we will look at both.
These measure how well your machine performs on a daily basis. Examples would be latency, F1 score balance, and API tokens.
These will tell your data science teams how your model is performing.
These will measure how well your business is doing. Examples would be annual revenue increase, cost reduction, and customer retention.
These will tell your executives if your investment is paying off.
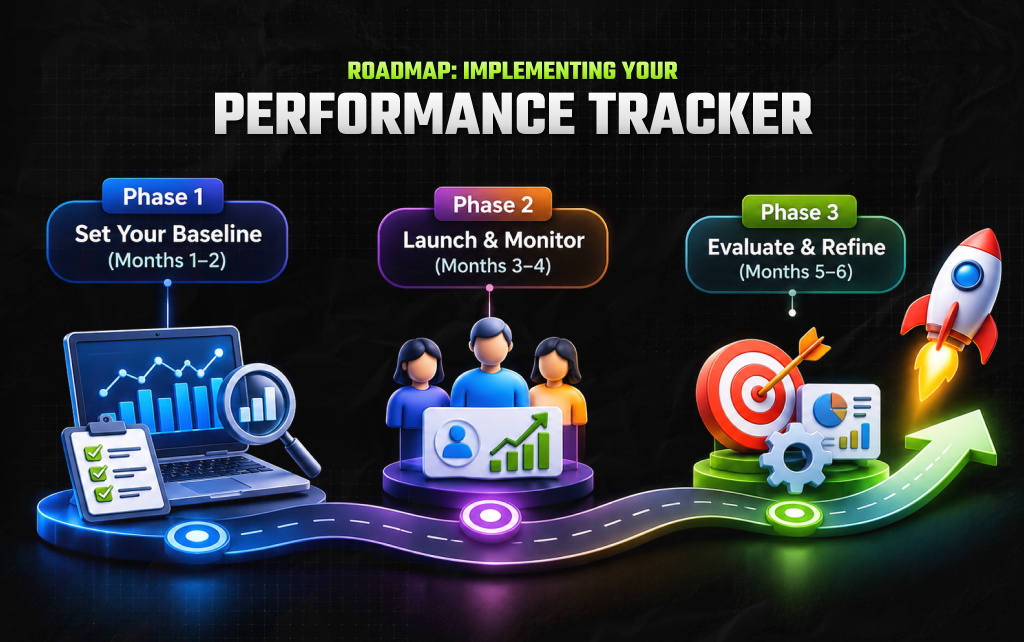
When you’re building a reliable evaluation setup, you will need a structured, phased rollout plan.
Before choosing new tools, measure your existing workflow baselines.
Moreover, you need to track metrics such as:
This gives you a clear pre-AI baseline to measure your progress against.
Roll out the software to pilot teams and focus on adoption metrics.
Also, track daily active users (DAU) and capture early feedback through shirt surveys.
Don’t stress about massive output gains yet; focus on getting your team comfortable with the new workflows.
Group your users into usage cohorts to compare performance against your original baselines.
Watch your quality metrics closely, including customer escalation rates and defect counts.
Use these insights to refine your automated testing and guide ongoing team training.
Piyasa is a search engine marketing strategist who has spent the last six years decoding Google's ever-changing mind. From corporate giants to neighborhood storefronts, she helps businesses cut through the digital noise and actually get noticed online. When she isn’t building SEO strategies or writing the latest search industry breakdowns for Search Engine Magazine, you can usually find her hanging out with friends - and gently reminding them that no, she cannot personally fix the latest algorithm update for them.
View all Posts

Enterprise Search Guide: Modern Knowledge Man...
Nov 03, 2026
How To Create A Group on WhatsApp Without Los...
Nov 03, 2026
The Ultimate AI Showdown: Is GPT 5.3 Codex Or...
Nov 02, 2026
Glean AI Pricing For Enterprise Search 2026: ...
Oct 31, 2026
Decoding Copilot Cost: The Ultimate 2026 AI P...
Oct 31, 2026