
SEO Dashboard: What To Track, What To Ignore, And How To Make It Useful
Sep 25, 2026
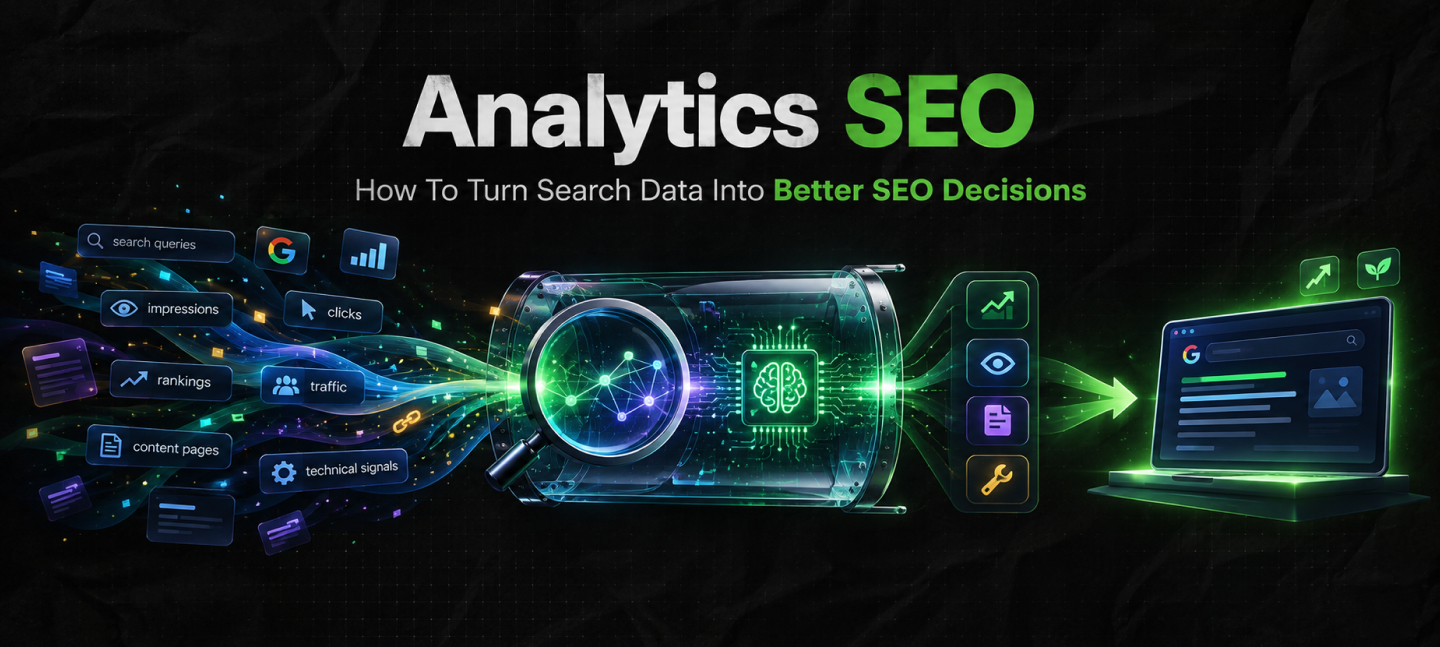

In the past decade I’ve spent in the search landscape, I’ve seen that it is super easy to collect SEO analytics. But the problem is using the same data properly.
Most sites already have a lot of data at their disposal – data that they can analyze properly.
Now, GSC shows impressions, clicks, queries, and positions, while analytics dashboards show conversions, engagement, and landing pages.
Then, you have SEO tools that help with information on competitors, backlinks, and rankings. At the end of the day, the issue is never a lack of data.
The problem is knowing which numbers should change what you do next.
A page can lose traffic while gaining visibility, while another page can attract fewer visitors but end up generating better leads.
That is precisely why analytics SEO isn’t really about building a better dashboard. Instead, it is about connecting search data to decisions.
And that is precisely why I’m here to breakdown SEO analytics and help you understand how to turn search data into better SEO decisions.
Stay tuned.
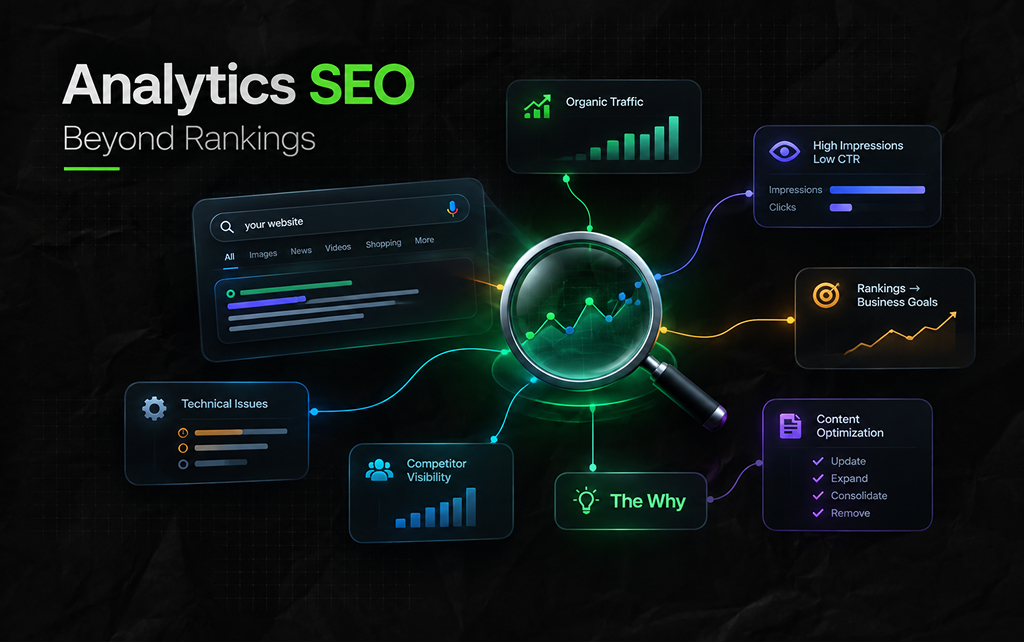
Analytics SEO is the use of search, website, and business data to understand how organic search is performing and where SEO work should change.
That includes more than tracking rankings.
A useful SEO analysis might ask:
Also, the distinction matters because SEO metrics describe what happened. Analytics should help explain why.
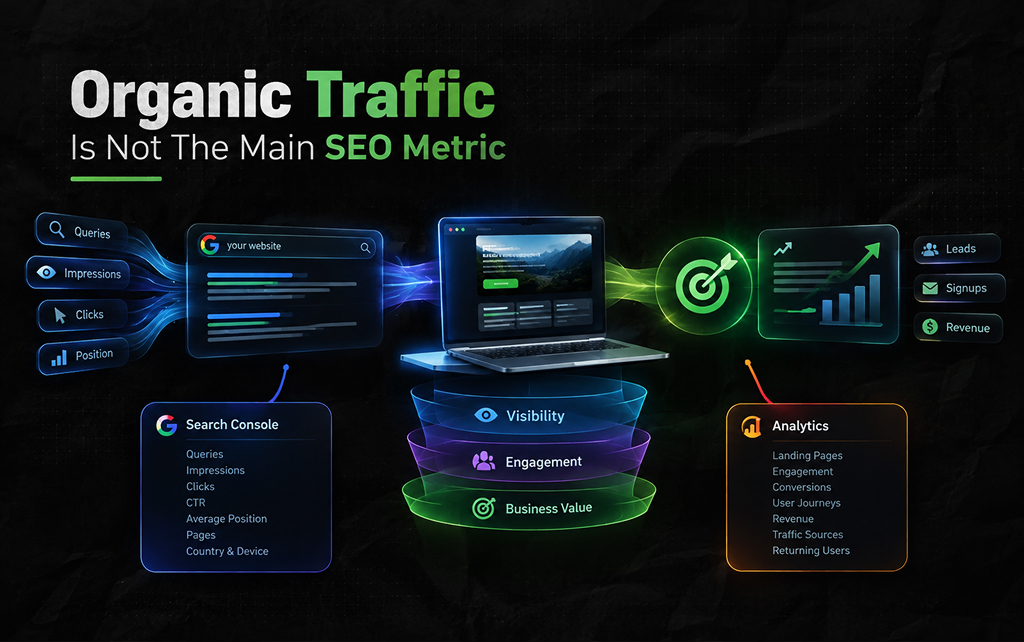
Of course, organic traffic is relevant and super useful. But you cannot look at it as a complete measure of overall SEO performance.
Now, imagine a website gets around 20,000 organic visits monthly as compared to 15,000 visits monthly.
That does sound positive.
However, suppose most of the extra traffic on the site came via informational searches that will ultimate not lead to an inquiry or signup.
As a result, the traffic increased, but its impact on the business may not have.
Now consider the opposite situation.
Organic traffic falls by 10%, but the remaining visitors come from more commercial searches and produce twice as many qualified leads.
As a result, looking only at traffic would make the second situation appear worse. This is why SEO reporting should separate at least three layers:
Also, in this context, it is essential to note that while these layers are connected, they don’t have any interchangeability.
TBH, it really annoys me when I see new SEO professionals make the mistake of treating Google Search Console and website analytics as competing sources of truth.
I mean, both are relevant, considering both measure different aspects of the same journey. FYI, Search Console helps you understand what happened before the click.
So, you can use it to examine:
In contrast, your analytics platform helps you understand what happened after the click. That can include:
As a result, you can put them together and get a much more useful picture.
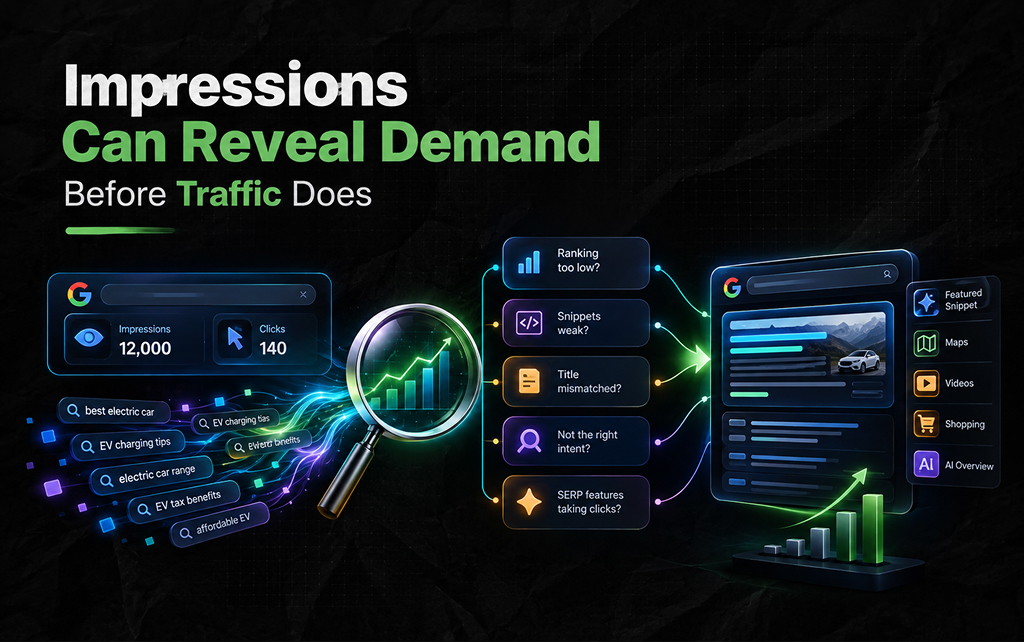
Impressions are often dismissed because they do not represent visits. That misses their diagnostic value.
So, suppose a new article receives: 12,000 impressions and 140 clicks. The click volume may look disappointing.
But the impressions tell you that Google is already testing the page against a meaningful set of searches.
That creates several questions.
Or is the search landscape increasingly answering the query directly?
Also, to be fair, impressions become much more useful when you investigate the queries and positions behind them.
A low click-through rate automatically doesn’t mean you have to rewrite the title. Frankly, CTR depends heavily on multiple things, including:
Instead of asking “Why is my CTR low?” ask “Is this page receiving fewer clicks than we would reasonably expect given its visibility?”
Then inspect the actual search results. Sometimes the problem is the title. Sometimes competitors have stronger results.
And sometimes the query has maps, shopping results, videos, featured snippets, AI-generated answers, or other elements taking attention away from traditional listings.
The data gives you the signal. But the SERP gives you the context.
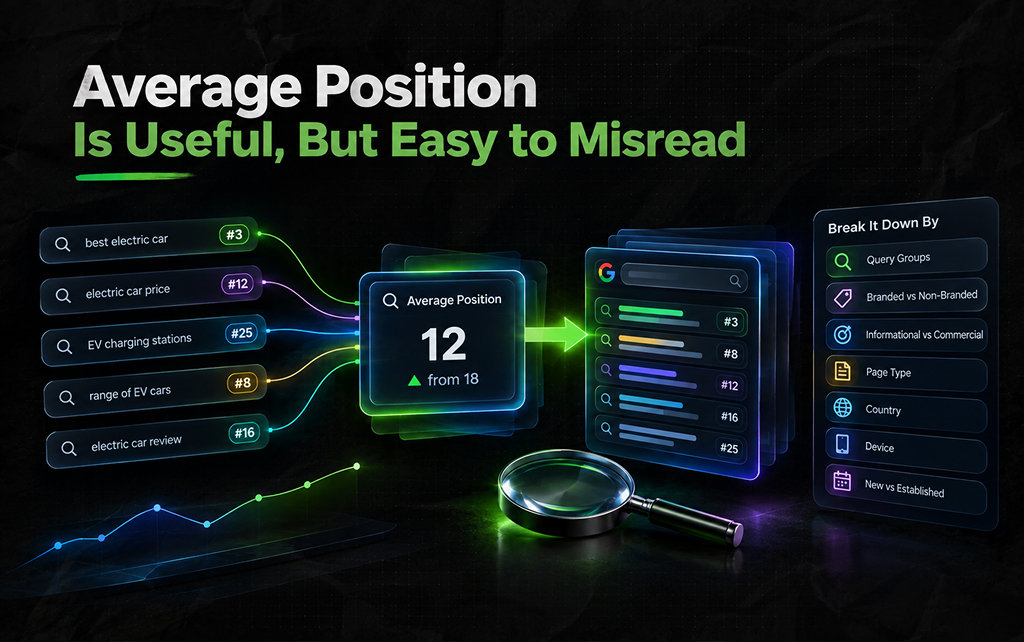
Average position looks precise.
TBH, the concept isn’t as simple as it might appear on the surface – I’ll tell you how. So, a page can rank for multiple search queries at different positions on SERPs.
Now, the reported average is a summary of all those appearances into a single number.
That means a page moving from an average position of 18 to 12 does not necessarily mean every important keyword improved.
The opposite can happen too.
So, a page may maintain a similar average position while losing visibility for its most valuable searches.
Also, for serious analysis, break performance down by:
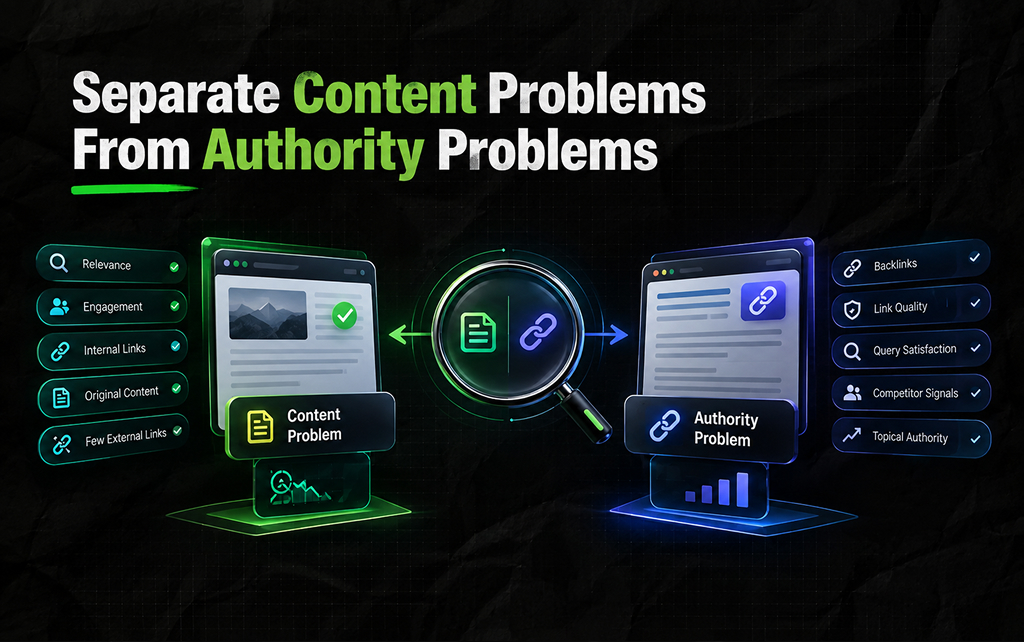
SEO analytics becomes much more useful when it helps you identify the type of problem.
Now, consider a page with:
If it consistently ranks below established competitors, the problem may not be the content itself.
Now consider a page with many backlinks but poor rankings. That suggests a different investigation.
Perhaps the links are irrelevant. Perhaps the page does not satisfy the query. Or perhaps competitors provide better information.
Also, it is possible that the site’s broader topical signals are weak.
This is why adding more content or more backlinks should not be the automatic response to every SEO decline. As a result, first identify the constraint.
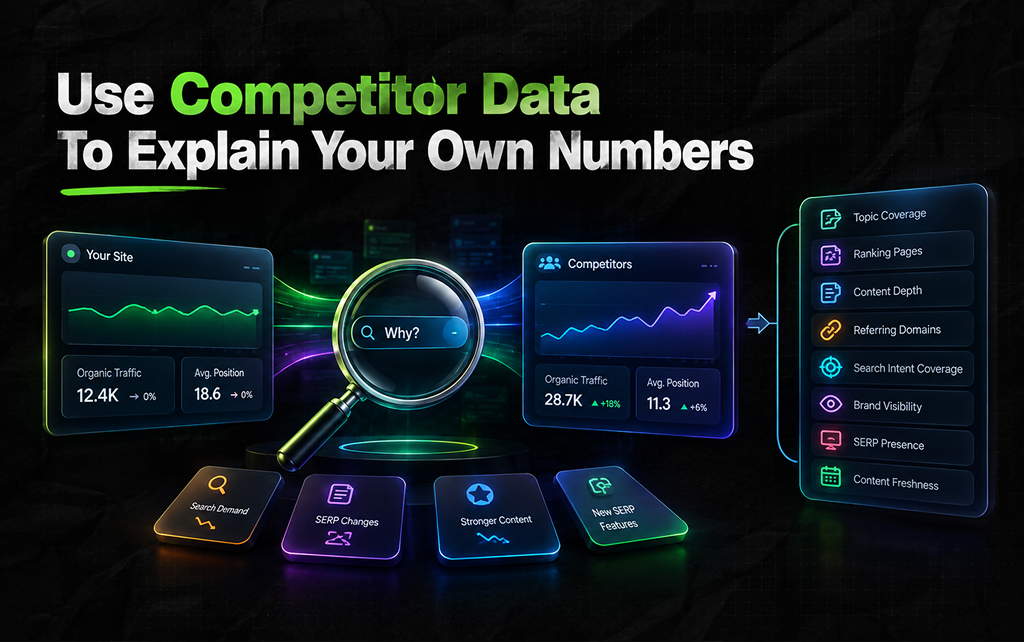
Your analytics tell you what happened to your site. And competitor analysis can help explain why.
So, suppose your organic traffic is flat. That alone does not tell you whether your SEO strategy is failing.
Search demand may have declined. The SERP may have changed. A competitor may have published a stronger resource. A new search feature may have reduced clicks.
Also, it is possible your competitors might be gaining visibility on topics you have ignored. In that case, compare:
The objective is not to copy competitors. Instead, it is to identify where the search landscape changed while your strategy stayed the same.
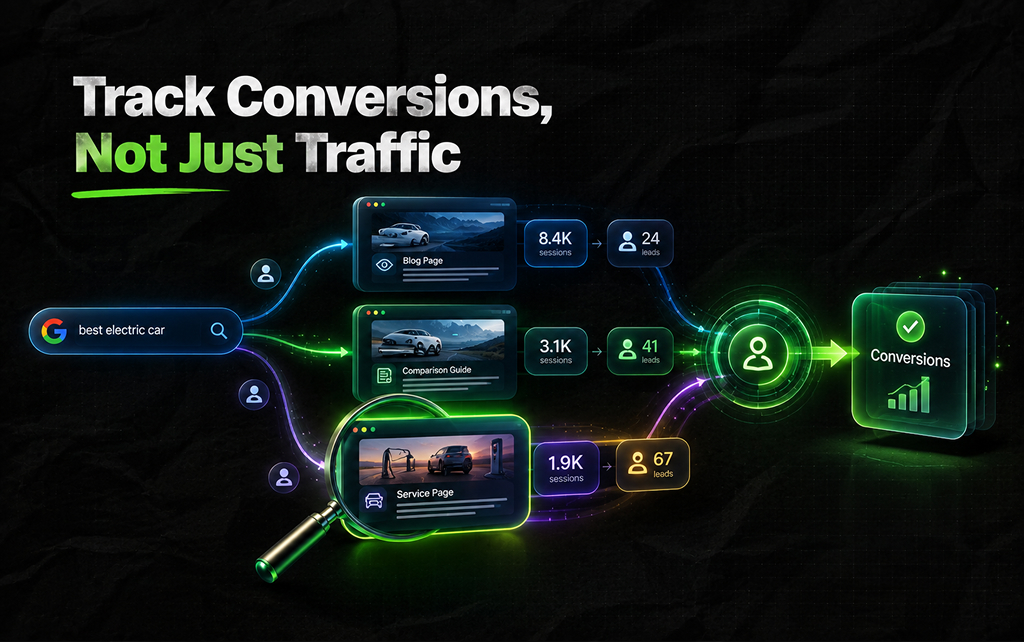
SEO reporting often stops at “organic conversions.” That number is too broad to guide content decisions. Instead, connect conversions to the pages that initiated or influenced them.
For example:
| Landing page | Organic sessions | Leads | Lead rate |
|---|---|---|---|
| Blog A | 8,400 | 24 | 0.29% |
| Blog B | 3,100 | 41 | 1.32% |
| Service page | 1,900 | 67 | 3.53% |
Blog A may be the traffic leader. But Blog B may be a much stronger commercial asset. That does not mean Blog A should be ignored.
Instead, it means each page should have a different job.
Some pages create awareness. Some capture demand. And some support consideration. Plus, some might directly generate conversions.
Your analytics model should reflect those roles.
A useful SEO dashboard should answer questions, not simply display numbers.
Instead of reporting ‘Organic traffic: 42,318,’ report ‘Organic traffic increased 14%, mainly from three commercial landing pages. Informational traffic was flat.’
Also, instead of ‘Average ranking: 8.7,’ report ‘Priority commercial queries improved, while overall average position remained flat because new informational rankings expanded the keyword set.’
Note how the second version gives someone something to act on.
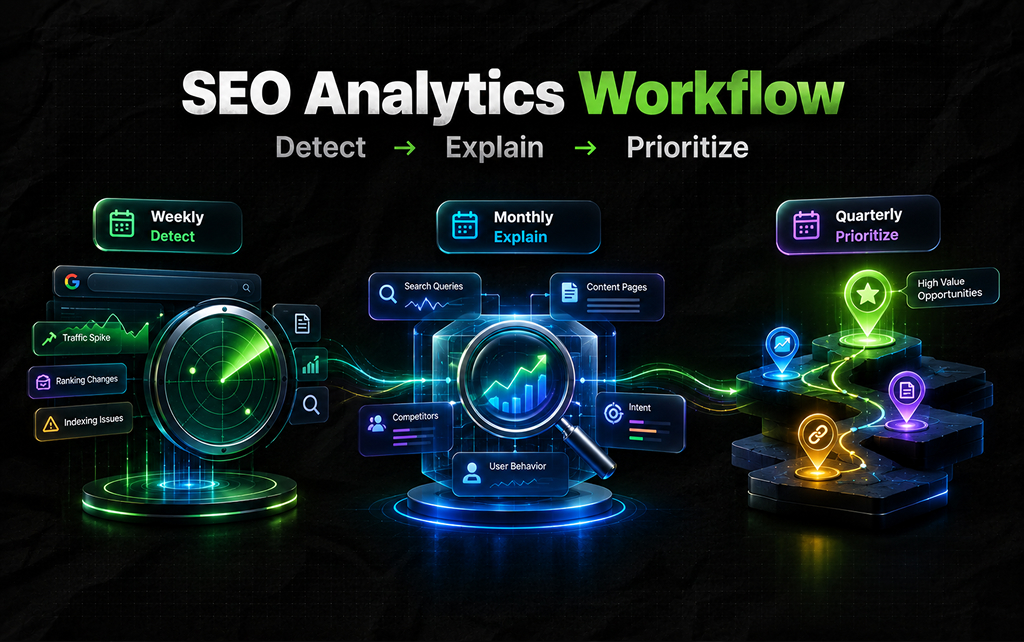
You do not need to analyze every metric every day. A practical workflow can run in layers.
Look for meaningful movements:
So, one thing is obvious – the goal is detection.
Go deeper into:
In this case, the goal is explanation.
Ask bigger questions:
As a result, the goal in this case is prioritization.
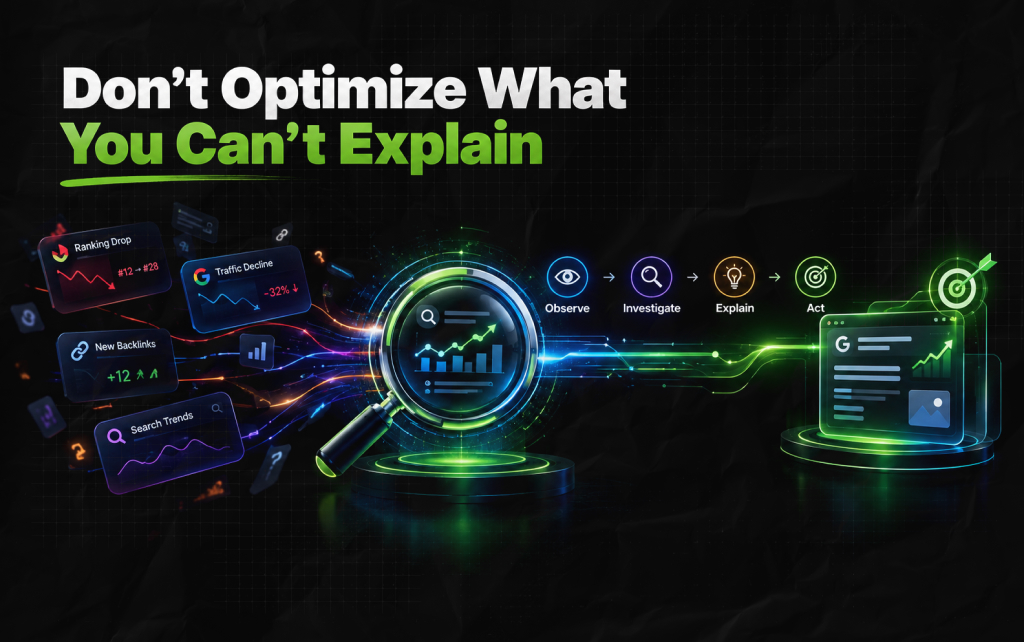
One of the biggest problems with SEO analytics is reacting too quickly.
A ranking falls, so someone changes the title. Traffic drops, so someone publishes more content. Then, a competitor gains links, so someone starts a new outreach campaign.
None of those actions is automatically wrong. But they are weak decisions if nobody understands the underlying problem.
As a result, a better sequence is: Observe → Segment → Investigate → Explain → Act → Measure
That small change can prevent a lot of unnecessary SEO work.
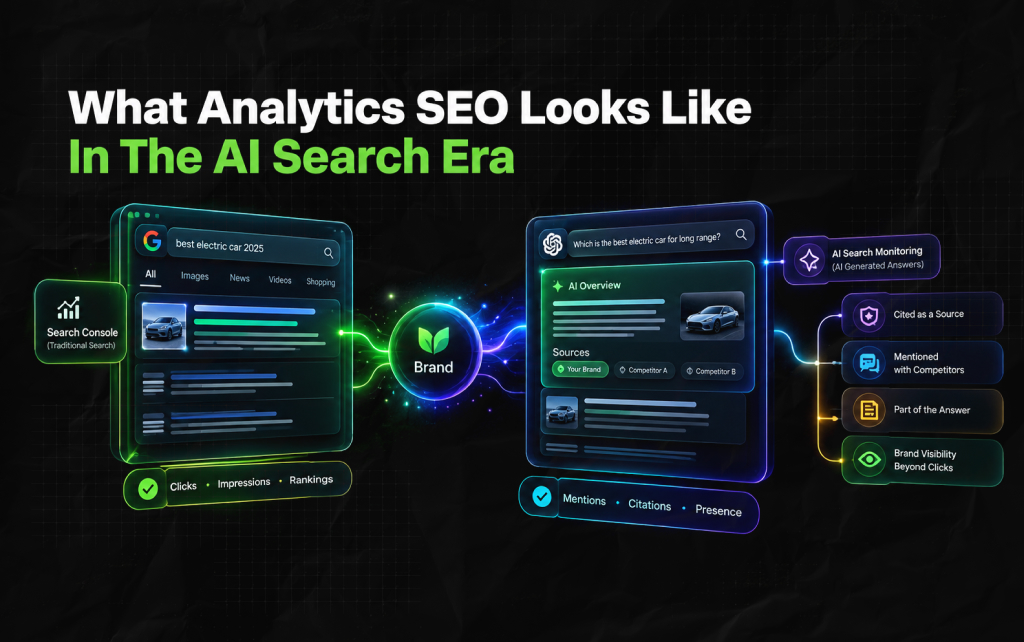
Of course, traditional SEO analytics still matter.
However, there is no denying that search visibility is becoming increasingly difficult to describe via clicks alone.
TBH, a brand can easily appear in AI Overviews without getting a single conventional organic visit from that engagement.
Also, it can be cited as a source, mentioned alongside competitors, or become part of the information used to construct an answer.
That creates another layer of analysis.
As a result, SEO teams increasingly need to understand not only “where do we rank?” but also “how is our brand represented when people ask questions about our category?”
This does not make traditional SEO analytics irrelevant. It makes the measurement model broader.
Search Console can tell you what happened in Google’s traditional search results. AI-search monitoring can add another view of how the brand appears across AI-generated answers.
But the important part is to keep those measurements separate instead of making it seem like both things represent the same sort of thing.
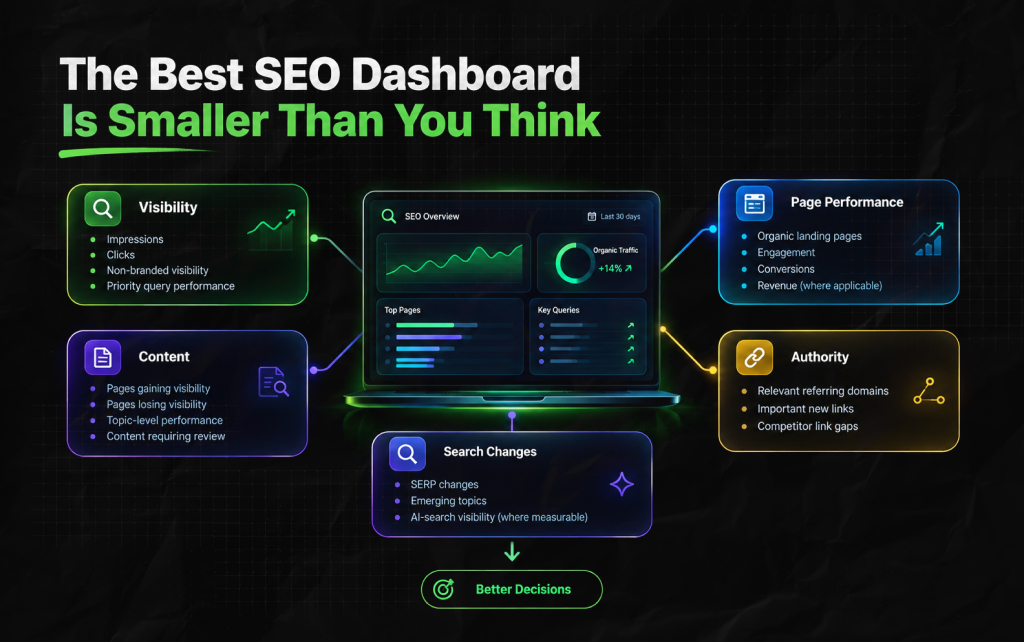
A dashboard does not become useful because it contains 40 metrics. Instead, for many SEO teams, a practical core set could include:
Then add metrics based on the business.
The goal is not to monitor everything. Instead, it is to make the next SEO decision easier.
Analytics SEO is not about collecting more numbers. It is about turning search data into explanations.
A ranking report tells you where a page appeared. Analytics can help you understand what happened next.
And that’s not all. Search Console can show where visibility changed. Competitor data can reveal what changed around you. And conversion data can tell you whether the traffic mattered.
Put those pieces together, and SEO becomes less reactive.
So, you need to stop asking, “What metric should we improve?” Instead, you need to start asking better questions, including:
That is where SEO analytics becomes useful.
Barsha is a seasoned digital marketing writer with a focus on SEO, content marketing, and conversion-driven copy. With 8+ years of experience in crafting high-performing content for startups, agencies, and established brands, Barsha brings strategic insight and storytelling together to drive online growth. When not writing, Barsha spends time obsessing over conspiracy theories, the latest Google algorithm changes, and content trends.
View all Posts

SEO Dashboard: What To Track, What To Ignore,...
Sep 25, 2026
AI Search Tools: What They Actually Measure A...
Sep 25, 2026
FAQ Schema: When It Still Makes Sense And Whe...
Sep 25, 2026
The Keyword With 10 Searches That Sent Ahrefs...
Sep 24, 2026
Paying Freelance Writers In Ten Countries: An...
Sep 24, 2026