

SEO Dashboard: What To Track, What To Ignore, And How To Make It Useful
Sep 25, 2026
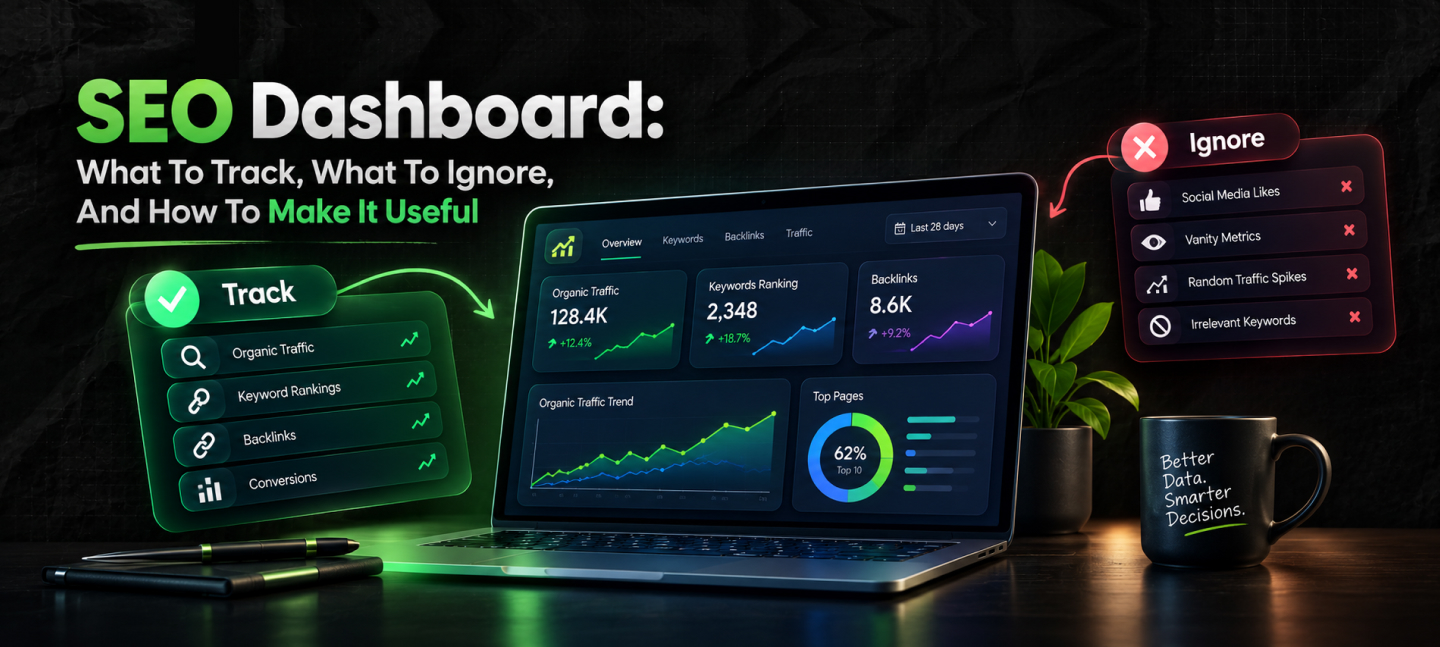

I’ve spent nearly a decade in the search landscape. And you will be surprised to know that even the most visually appealing SEO dashboard can turn out to be useless and irrelevant.
You can spend hours filling it with traffic, backlinks, domain metrics, conversions, and other important parameters.
And the dashboard will give you something to look at every week. But frankly, looking at so much data isn’t really the same as understanding what SEO performance actually means.
TBH, an effective dashboard should answer something very simple – something like what really changed, and more importantly, why did that happen.
Also, what can we do about this change?
And for that, you need fewer metrics, better context, and an established relationship between search performance and your business goals.
Today, I’m going to discuss SEO dashboards, highlighting what you should track and what you should ignore. Also, I am going to break down how you can make these dashboards useful for your daily operations.
Stay tuned.
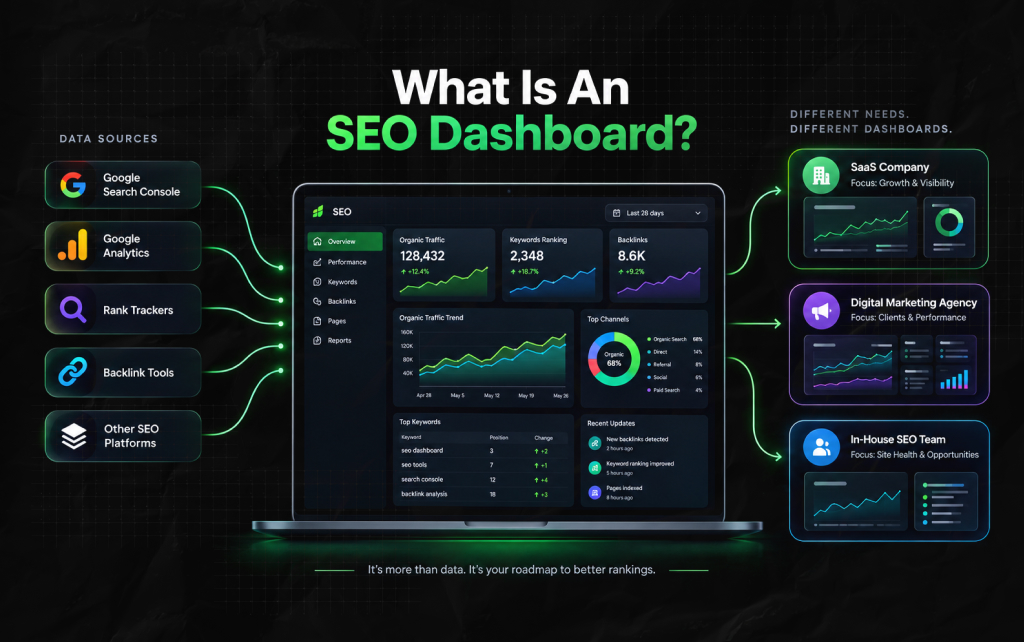
An SEO dashboard is a central view of the metrics and trends used to monitor organic search performance.
It can pull data from sources such as Google Search Console, Google Analytics, rank trackers, backlink tools, and other SEO platforms.
However, to be very honest, the technology is the easiest part here – the difficulty appears when you are in the middle of taking a call on what needs to be on your dashboard.
For instance, a SaaS company and a digital marketing agency cannot have the same type of dashboards.
Similarly, an SEO agency with 25 clients will need a different dashboard from an in-house SEO team working with one website.
For years, I’ve seen new SEO professionals struggle trying to monitor everything simultaneously.
Frankly, it almost always begins with the right intention.
Someone adds organic traffic. Then rankings and impressions, followed by clicks and CTR.
And you’ll see it’s still not enough. Someone will add backlinks and referring domains, followed by indexed pages. Then keyword visibility and competitors.
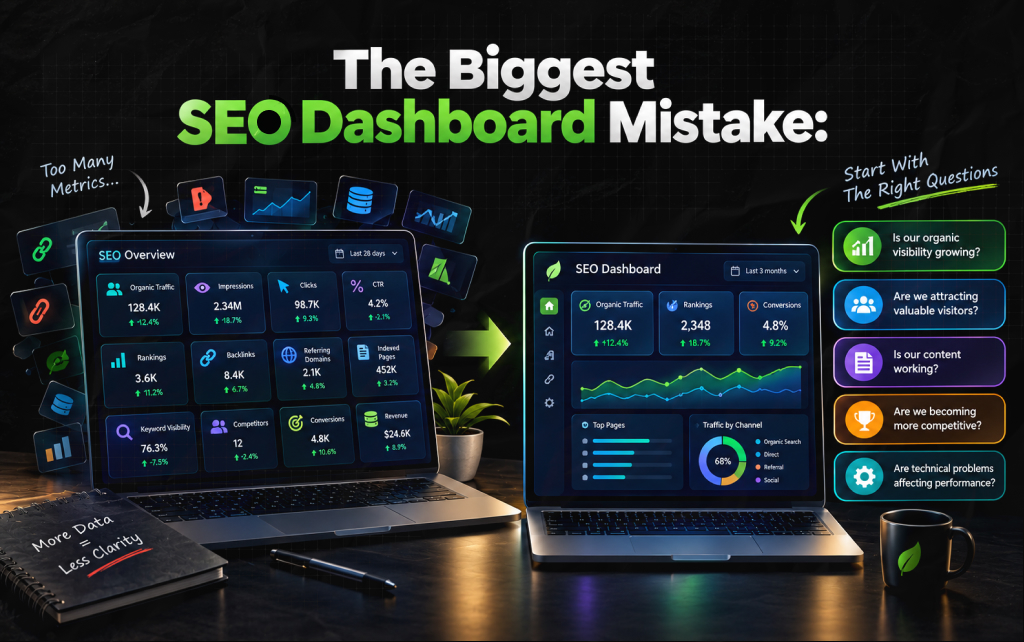
And soon, your SEO dashboard has more than 20 metrics – by then, nobody knows (or cares) about them which metrics actually matter.
Of course, data is essential. But there’s no denying that more data can lead to less clarity.
Why? Because important changes almost always end up getting buried among too many numbers that don’t really need any action.
Instead, a better dashboard starts with business and SEO questions, not available metrics.
Before you can take a call on what you should track, you need to decide what information you actually need.
For example:
1. Is our organic visibility growing? In that case, you need to monitor impressions and clicks on your site. Also, track priority rankings and non-branded search visibility.
2. Are we attracting valuable visitors? For this, you need to track your organic landing pages – keep checking your conversions, leads, and revenue.
3. Is our content working? Track page-level traffic, query visibility, conversions, and content trends.
4. Are we becoming more competitive? Track relevant competitor visibility, topic coverage, and referring-domain patterns.
5. Are technical problems affecting search performance? Track indexing, crawl-related issues, page experience, and other relevant technical signals.
As a result, you can see that each question produces a different dashboard. And that is much better than starting with a list of metrics and trying to find a purpose for them afterward.
And that is much better than starting with a list of metrics and trying to find a purpose for them afterward.
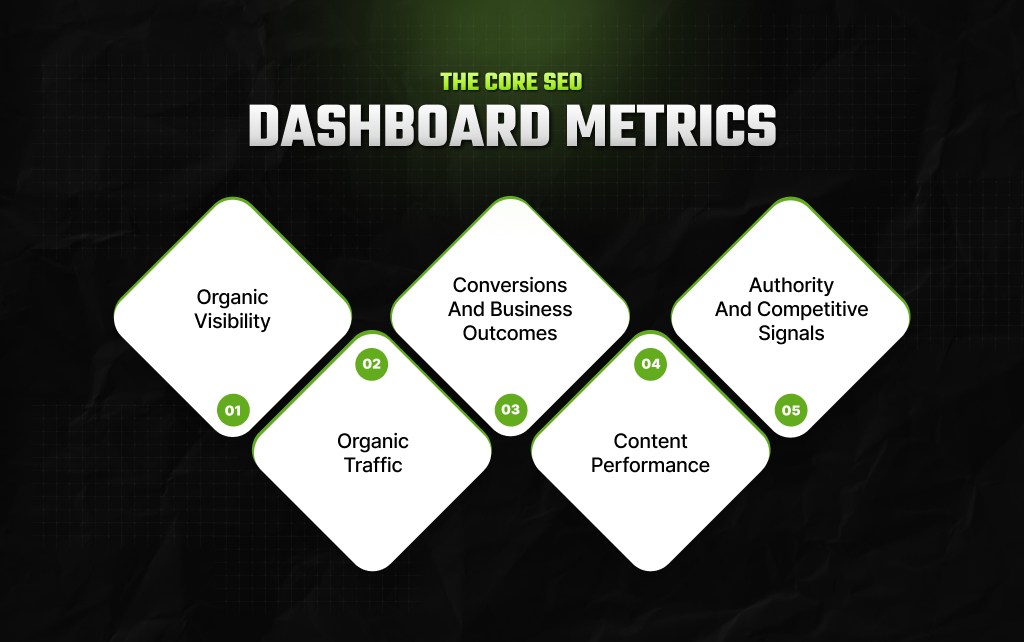
So, most websites can build a useful dashboard around five broad areas.
This tells you whether the site is appearing more often in search. In that case, the most useful metrics include:
Do not rely on one visibility metric.
Also, a site can gain thousands of impressions because it started appearing for low-value searches.
That does not necessarily represent meaningful SEO progress. My advice is to break visibility down by topic, page type, and search intent whenever possible.
Traffic tells you what happened after people chose your search result. As a result, you should track:
But always connect traffic to context.
Also, an increase in traffic might come from a seasonal topic, whereas a decline in traffic might follow a drop in search demand.
Moreover, a new page might bring significant traffic without contributing much commercial value. The number needs an explanation.
Frankly, this is where I’ve seen so many SEO dashboards disconnect from the user’s business goals.
Let me break it down for you – if organic search generates leads and signups (or any other meaningful action) for your business, then those outcomes need to be on the dashboard.
For instance, you can show it in the format below:
| Metric | This Month | Previous Month | Change |
|---|---|---|---|
| Organic Sessions | 42,000 | 38,500 | +9.1% |
| Organic Leads | 312 | 276 | +13.0% |
| Lead Rate | 0.74% | 0.72% | +0.02 pp |
| Organic Revenue | ₹18.4L | ₹16.9L | +8.9% |
This tells a much more useful story than traffic alone. And even then, I believe that attribution needs care.
Moreover, SEO can influence a conversion without being the final traffic source. Depending on the business, assisted conversions and longer customer journeys may matter.
A site can publish hundreds of pages without knowing which ones are actually doing useful work.
As a result, your dashboard should help identify:
This creates a bridge between reporting and content decisions.
Instead of saying, ‘traffic is down,” you can say “traffic declined mainly because six previously strong articles lost visibility for their primary topic.”
That is actionable.
Backlinks can be useful indicators, but a dashboard should not become a backlink scoreboard.
As a result, you can track signals that help explain authority and competitiveness:
Also, I would recommend avoiding metrics like DR or DR – they aren’t direct measurements of rankings on Google Search.
Instead, they are just third-party estimates. They can help with comparison and research, but they should not become the objective of the SEO program.
“Average ranking” is one of the most tempting metrics to put at the top of an SEO dashboard. Also, it is easy to misuse.
A website can improve its average position while losing visibility for important commercial searches.
Also, it can see average rankings decline because new pages started ranking for a wider set of terms. Neither situation is necessarily bad.
Instead of relying on one average, separate rankings into meaningful groups.
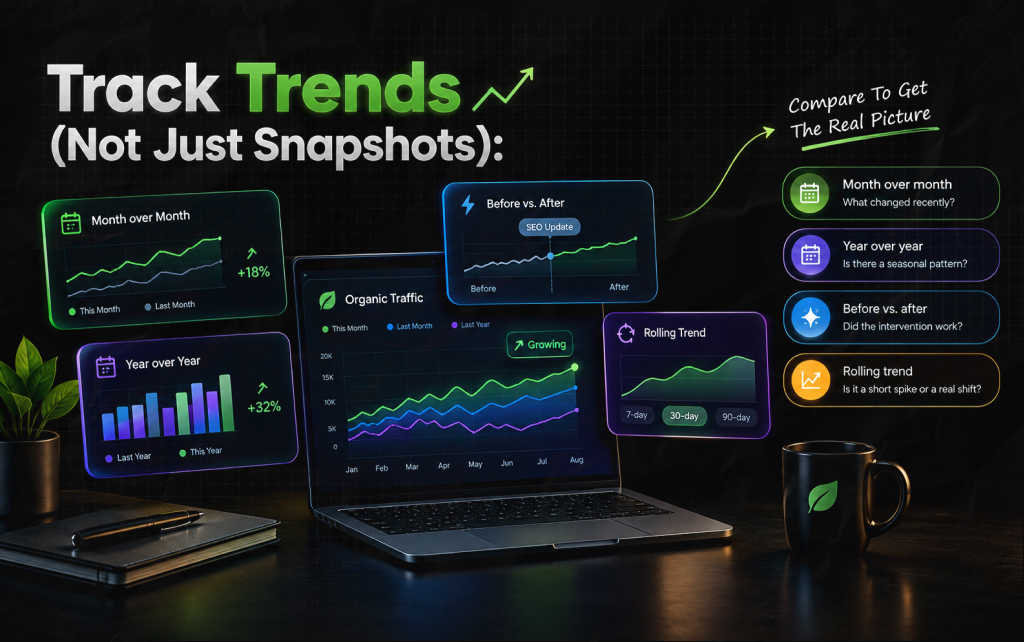
If your SEO dashboard shows only this month’s numbers, then it is incomplete. Why? Because SEO rarely works on a clean monthly cycle.
Content published three weeks ago may still be gaining visibility. A technical change may take time to affect crawling.
Similarly, a ranking decline may reflect a broader algorithm change rather than something your team did.
So every important metric needs a comparison. On that note, useful comparisons include:
Also, note that the period of comparison in this context should ideally align with the question.
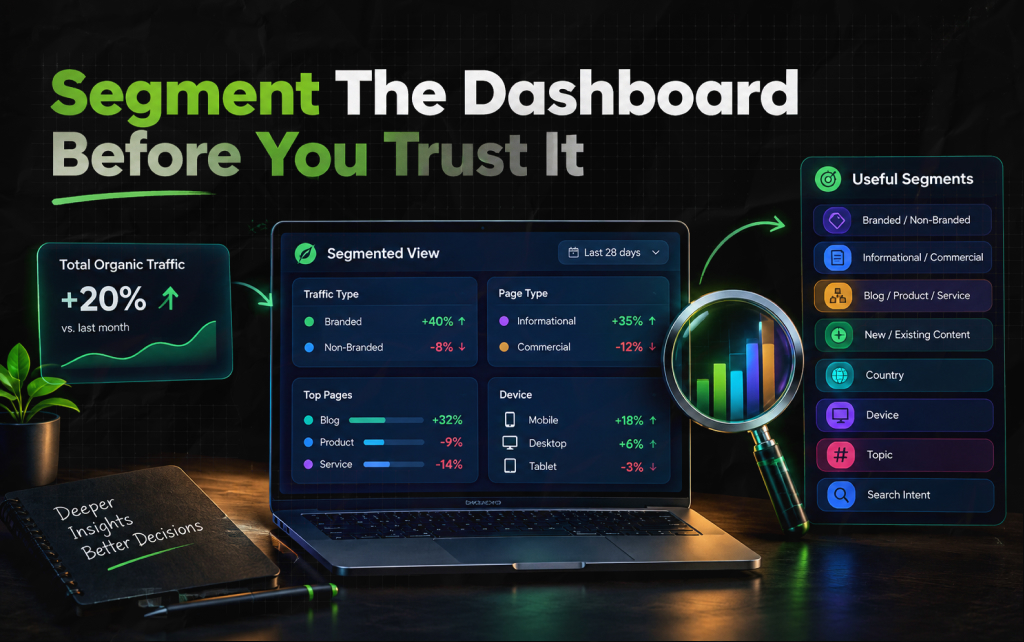
A single site-wide number can hide important differences. Now imagine your organic traffic has witnessed a 20% increase.
That does sound good, doesn’t it? Then you discover:
The original number tells a very different story once segmented. In fact, useful segments include:
You do not need every segment on the main dashboard.
Instead, the dashboard should highlight important patterns and allow deeper investigation when necessary.
My experience in the search landscape has taught me one important thing: organizing your dashboard.
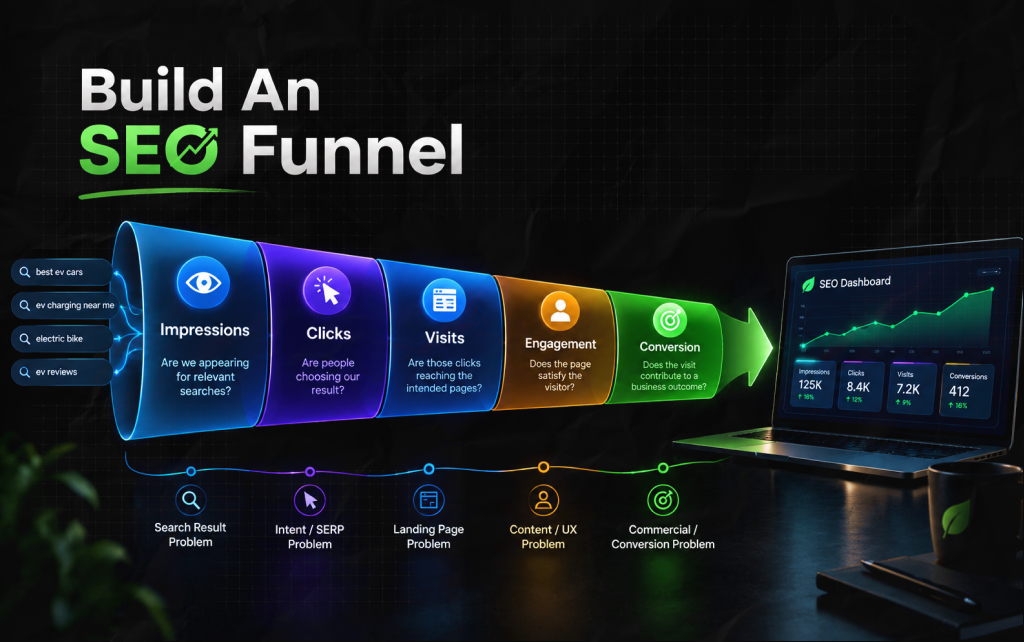
Now, one of the most effective ways to do that is to build an SEO funnel and create a dashboard around your site’s search journey.
So, you can think of it as: Impression → Click → Visit → Engagement → Conversion. Each stage in this funnel answers an entirely different question.
1. Impressions: Are we appearing for relevant searches?
2. Clicks: Are people choosing our result?
3. Visits: Are those clicks reaching the intended pages?
4. Engagement: Does the page satisfy the visitor?
5. Conversion: Does the visit contribute to a business outcome?
This structure makes diagnosis easier.
Moreover, high impressions but low clicks may indicate a search-result problem, whereas strong clicks but weak engagement may indicate an intent or landing-page problem.
Similarly, strong engagement but few conversions may indicate a commercial or conversion problem.
The point? Your SEO dashboard should help you locate the problem instead of simply announcing that one exists.
This is one feature most dashboards lack. The dashboard tells you that something changed, but it does not record what the team did about it.
Add a simple action log:
| Date | Change | Page/Area | Expected Impact | Result |
|---|---|---|---|---|
| Sept 3 | Updated title + intro | /topic-a/ | Improve CTR | Monitoring |
| Sept 8 | Consolidated two articles | /topic-b/ | Reduce overlap | Monitoring |
| Sept 12 | Added internal links | Content cluster | Improve discovery | Positive |
This creates institutional memory.
Six months later, you can look at performance changes alongside actual SEO work. And that is much more valuable than another chart.
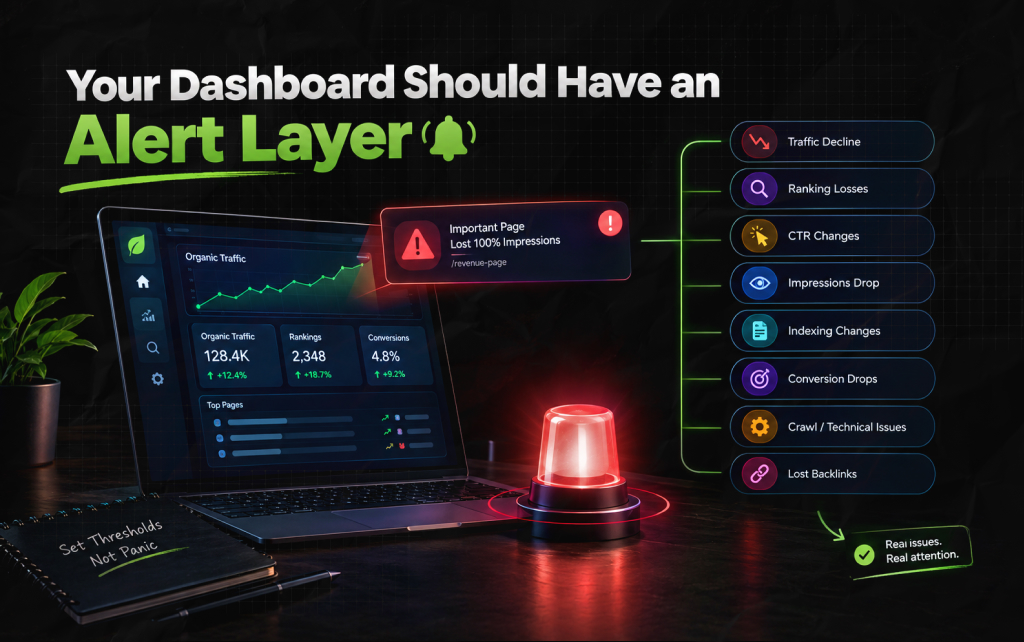
Not every change deserves human attention. TBH, a useful dashboard can flag exceptions such as:
The point is not to create panic every time a number moves.
Instead, set thresholds around meaningful business or SEO changes. A 2% ranking movement probably does not need an alert. But a sudden disappearance of a major revenue page might.
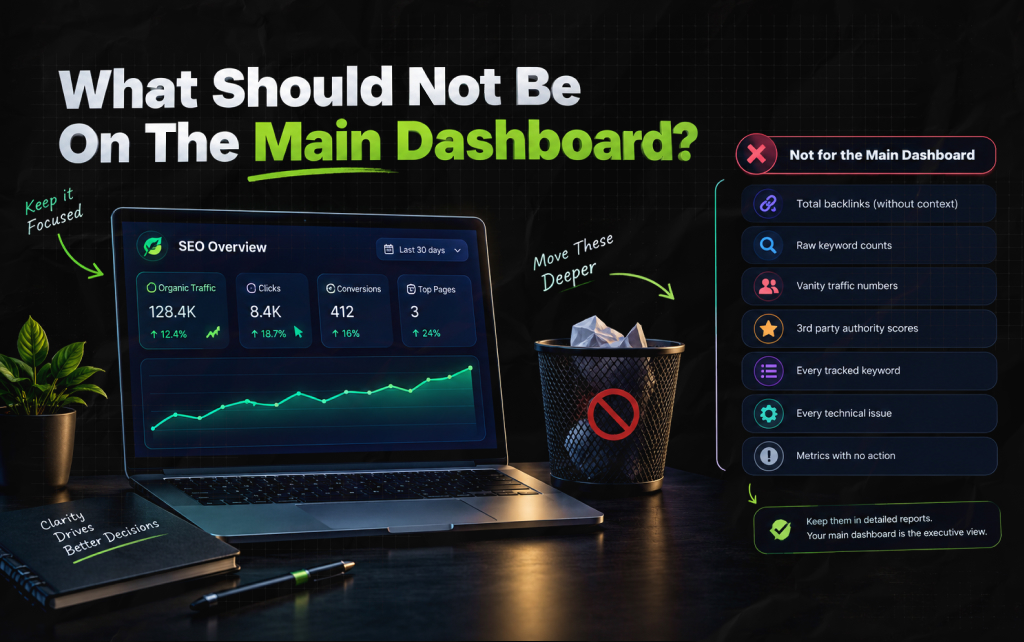
Some metrics are useful during analysis but do not deserve permanent prime real estate. In this context, the most common examples include:
This does not mean those metrics are useless. Instead, it means they belong deeper in the reporting system.
Your main dashboard should be the executive view. The detailed reports can contain the investigative data.
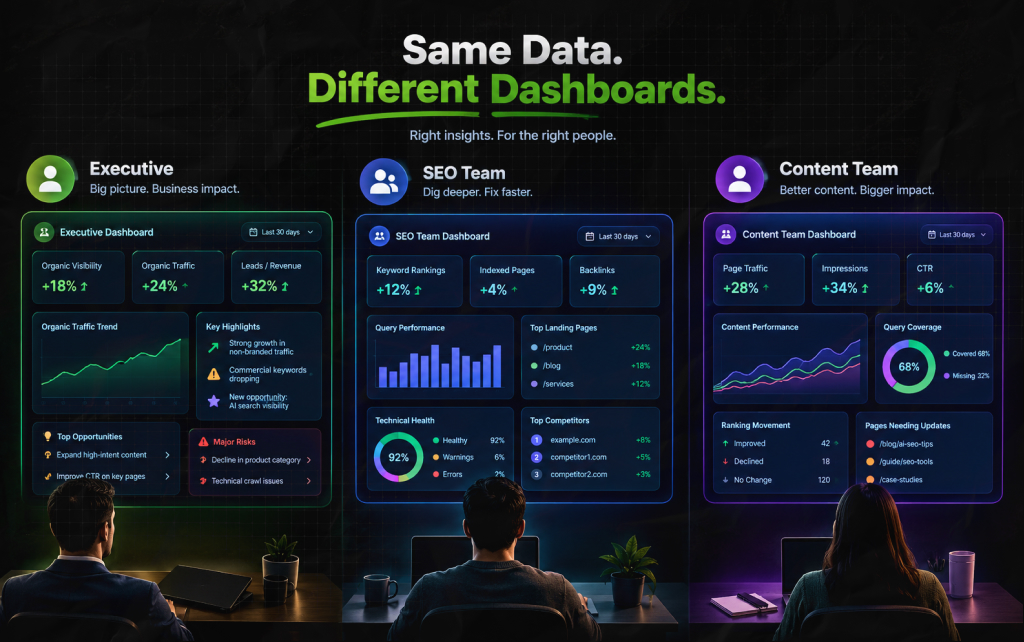
An SEO specialist and a CEO do not need the same dashboard.
Keep it focused on:
Go deeper into:
Focus on:
The data can come from the same sources. But the view should change based on the decision-maker.
Search results are changing quickly.
Traditional rankings remain important, but SEO teams also need to understand changes in the search environment.
Depending on the business, this may include:
These should not simply be dumped into the same ‘SEO score.’ Instead, they represent different forms of visibility.
Keeping them separate makes the dashboard more honest and easier to interpret.
For many brands and businesses, a simple SEO dashboard can look like this:
| Row | Metric | What It Should Cover |
|---|---|---|
| Top Row | Business Performance | Organic traffic | Organic leads | Organic revenue | Conversion rate |
| Second Row | Search Visibility | Impressions | Clicks | CTR | Priority keyword visibility |
| Third Row | Content | Top gaining pages | Top declining pages | High-impression/low-click pages | Content conversions |
| Fourth Row | Authority | Relevant referring domains | Lost important links | Competitor gaps |
| Fifth Row | Technical Health | Indexed pages | Important indexing issues | Core technical alerts |
| Sixth Row | Search Landscape | SERP changes | AI-search visibility | Emerging topics |
| Bottom Section | Actions | What changed → Why → What we’re doing next |
That last section is what turns a reporting dashboard into a management tool.
This distinction matters.
Your SEO dashboard can definitely help you understand why organic traffic on your site dropped.
But it cannot directly tell you whether you should fix technical problems, modify existing content, get quality backlinks, or create new content.
The data needs interpretation.
As a result, a ranking decline, for instance, might come from:
The dashboard identifies the signal. The SEO team investigates the cause. And that separation prevents dashboards from becoming automated decision-makers.
Barsha is a seasoned digital marketing writer with a focus on SEO, content marketing, and conversion-driven copy. With 8+ years of experience in crafting high-performing content for startups, agencies, and established brands, Barsha brings strategic insight and storytelling together to drive online growth. When not writing, Barsha spends time obsessing over conspiracy theories, the latest Google algorithm changes, and content trends.
View all Posts

Analytics SEO: How To Turn Search Data Into B...
Sep 25, 2026
AI Search Tools: What They Actually Measure A...
Sep 25, 2026
FAQ Schema: When It Still Makes Sense And Whe...
Sep 25, 2026
The Keyword With 10 Searches That Sent Ahrefs...
Sep 24, 2026
Paying Freelance Writers In Ten Countries: An...
Sep 24, 2026