How To Track Brand Citations In ChatGPT And Perplexity?
Apr 30, 2026

So, what report indicates where users start or exit the conversion funnel?
The answer is The Goal Flow Report.
Before learning what goal flow report is, you should know all the flow visualization reports. Google Analytics is essential for people who are into online business. As Google has the domination among search engines, every online business should know all the features about Google Analytics. As you already know the answer, it is time to learn about where the goal flow report comes from.
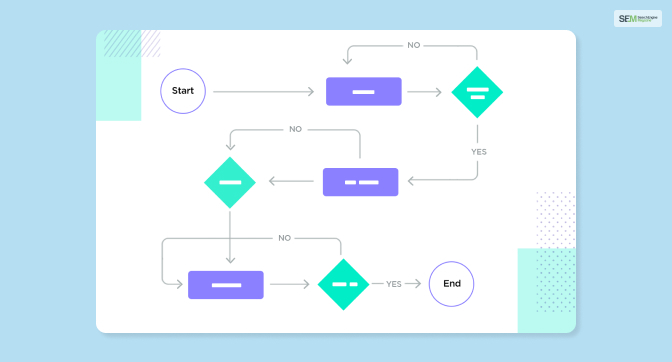
In simple words, flow visualization is a graphic that shows a path or a route. But do not think of it as a map where everything is displayed. The flow visualization is like an actual path as how someone travels step by step. In the steps, there can be backtracking or detours.
It simply implies the path that a user takes through content. There can also be special elements that someone tracks using Events and Goals. When there is a single graphic, that says how a user enters, engages, and then exits from your content. These reports are important for troubleshooting. You can also find any place from where a user loops back or exits.
Read More: What Are Google Patents?
When it comes to flow reports there are different types of flow reports with different features. Here are all the flow reports.
This report states the path of a user traveling from one event or page to the next one. This is a great way to understand which content is getting the most engagement on your website. So, you can make other content by knowing what people like the most. Secondly, you will also get to know about any potential content issues. The report also says events, content groupings, display pages, and both events and pages.
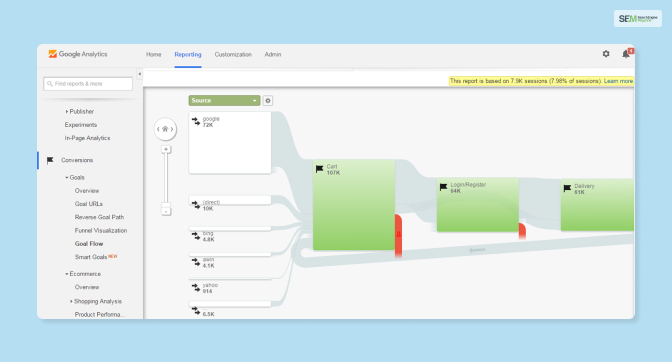
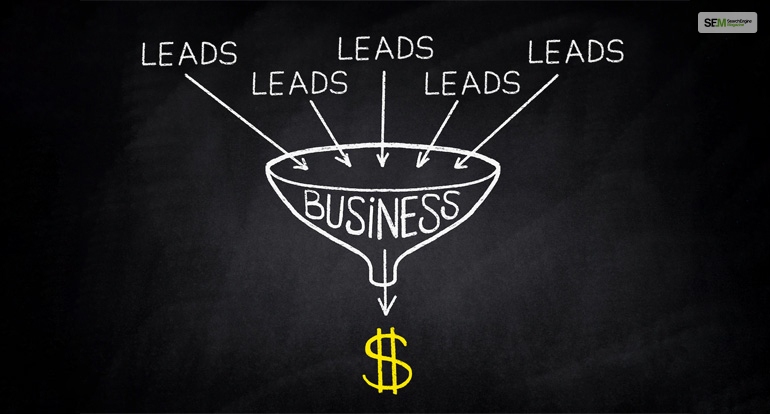
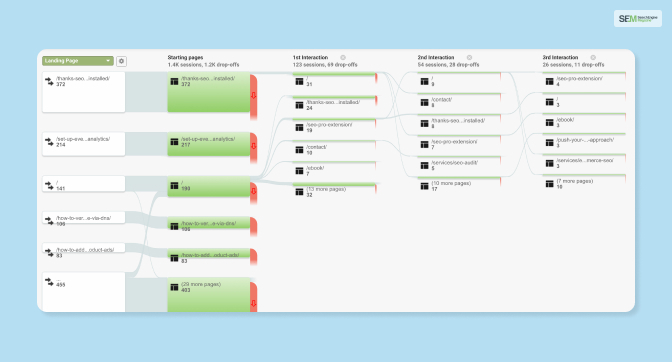
This was the answer to your question. It shows the whole path that your traffic travels through a funnel and finally reaches the goal conversion. The use of this report is to understand your users and whether they are navigating as expected. If there is any problem, unexpected loops, or drop-off, you will get to learn that also. All you need to do is to define funnels for your goals in your account.
This report states the volume of the traffic. And how the traffic comes from different sources. You can then examine patterns of the traffic. You will also get to know whether your marketing channels are working properly or not. You can also track how visitors are engaging with the content. So, you will be able to learn your underperforming and overperforming paths and pages.
The event flow reports tell you the order how users trigger events such as file downloads, video plays, and interactions with embedded gadgets. You can use the Behavior Flow report to know all this information.
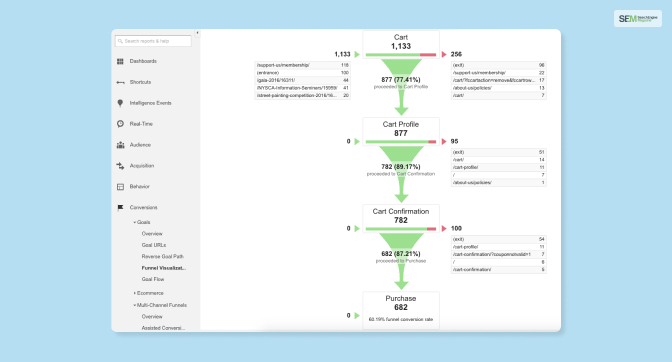
This report is also important as it gives an overview of the goal conversion funnel. You may confuse it between goal flow reports, but in this case, you will not be able to know the actual path that your users have taken. It only shows the performance of funnel steps, or you can say the entrances and exits. As this report shows the overall performance, you will be able to find drop-offs, and then you can analyze the problems.
This is kind of simple to understand. This flow report provides information about the volume of traffic flows through each stage. You can understand what content users find interesting.
Read More: Google Ads: Successful Strategies For Marketing Your Business
Here are some interesting questions and answers that most people tend to ask.
Ans: So, when people visit a website and before exiting the website, the Exit Pages report shows that. The information helps organizations to understand what is the last page that visitors see and why they are doing that. With the proper information, they can make strategies and changes so that people stay there longer. One of the best ways to do that is to add links to that page so that visitors may stay there longer than usual.
Ans: When it comes to knowing about Google Analytics’ Exit pages, you need to open Google Analytics. Then you will find the menu option on the left side of your screen. Now, you need to select Behavior, then click on the Site Content. There, you will find Exit Pages, just select that to track exit pages.
Ans: When you are running a website, this information is important to know to understand the audience’s behavior. First, you need to understand that exit means that how many time visitors leave a website from a single page. This is also called as the page’s exit rate. This indicates, a visitor comes to your website, surfs a couple of pages, and then leaves from which website. The metric shows in percentage, and it is important to make your website better for user experience and to know where the changes are needed the most. This is how the exit rate is calculated.
Exit number/ pageview number for a particular page.
So, next time someone asks you about what report indicates where users start or exit the conversion funnel?
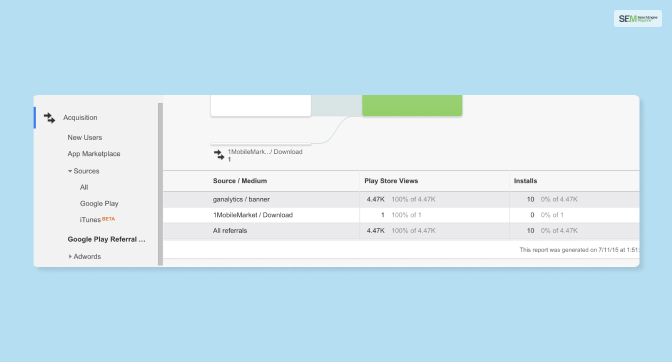
I hope you will not only tell them the answer, but you will also elaborate on The Goal Flow Report, what it is, how it works, and why it is important to know about it. Other than goal flow, if you want to learn more about flow reports, you must learn behavior flow, events flow, users flow, google play referral flow, and funnel visualization. This will help to understand the user journey more effectively.
I hope you have found this article interesting and informative. Please do not forget to give your valuable feedback.
Thank You.
Read Also:
Abdul Aziz Mondol is a professional blogger who is having a colossal interest in writing blogs and other jones of calligraphies. In terms of his professional commitments, he loves to share content related to business, finance, technology, and the gaming niche.
View all Posts
How To Track Brand Citations In ChatGPT And P...
Apr 30, 2026
Step By Step Plan To Reach 10K Followers With...
Apr 30, 2026
MIXX.com 2026 Review Explaining Why It’s St...
Apr 30, 2026
The Surprising Correlation Between Follower C...
Apr 30, 2026
Imagen AI Profile Building Vs VSCO Film Packs...
Apr 30, 2026